Short-cycle leafy greens look simple, yet they are among the most sensitive crops to small changes in water supply and microclimate. The leaf is the final product: heat stress, abrupt drying, or long periods of condensation quickly show up as poor appearance, brittleness, scorched edges, or uneven growth between rows. In protected structures, differences usually appear by zone, not as a meaningful “average.”
In dense stands, the air layer at leaf level behaves differently from the “general” air in a tunnel or greenhouse. Humidity can remain trapped under the canopy, and leaf temperature can drop below what a sensor mounted high in the structure reports. The result is local condensation, higher disease pressure, and leaves staying wet long after irrigation or after a cold night.
Connected sensors do not replace the grower’s eye or independent checks, but they can make visible the exact differences that create uneven batches: edges that dry faster, corners that condense, sectors that receive less water, or substrate that accumulates salts. Below is a guide to sensor selection, placement, and commissioning focused on decisions and verifying effects, not on applying a fixed irrigation “template.”
1) Why uniformity is hard in leafy greens: mechanisms behind the differences
Leafy greens have a large vegetative mass relative to root volume and can shift transpiration quickly. When water is briefly limiting, stomata close, growth slows, and leaves can thicken or become brittle; when humidity is excessive and air stagnates, leaf surfaces stay wet and cold zones form—conditions that can favor phytosanitary problems. In a 3–6 week cycle, these “short” episodes matter disproportionately because there is little time to recover uniformity.
What to observe: color differences between edges and center, leaves that “tighten” at midday, a morning water film in only certain sectors, or different growth pace at the same crop age. What to verify independently: check leaf wetness early (condensation), feel root-zone moisture in multiple points, and compare pressure/flow on irrigation branches. Practical decision: manage by zones (differentiated irrigation/ventilation). Check the result: over the next 24–72 hours, zone differences should shrink in trends, not just on a single good day.
2) Which parameters are worth monitoring—and what “correct measurement” means
For leafy greens, priorities are air temperature, relative humidity, and a derived indicator such as VPD, plus root-zone moisture (soil or substrate). VPD calculated from air temperature and RH is an estimate of atmospheric demand; the leaf can be at a different temperature than the air, especially at night or under cold drafts, so the VPD the leaf “feels” can differ. That is exactly why placement and zone-to-zone comparison matter as much as the number itself.
At the root zone, moisture is not the same as “how much you irrigated”: it depends on texture, compaction, mulch, drainage, and drip uniformity. If you also use EC/pH, keep the distinctions clear: pH and EC require dedicated probes; EC does not identify individual nutrients and must be linked to the medium measured (source water, fertigation solution, substrate extract, or bulk-soil EC). A laboratory water analysis remains complementary; on-site pH/EC monitoring confirms operational drift but does not replace full analysis.
3) Sensor selection: the useful minimum and common traps
A useful minimum set for leafy greens includes: one air temperature/RH sensor at leaf level, a second comparative one (for example at an edge or an end bay), and at least one soil/substrate moisture sensor in a representative zone. If you fertigate, add pH/EC measurement in the irrigation solution or in drainage/extract—only with a clear protocol defining what you compare. Fewer sensors well placed usually outperform many sensors placed “where it’s convenient.”
Traps include: treating one “general” air temperature as the true leaf microclimate; installing a soil-moisture sensor too close to a dripper (always reading “wet”) or too far (always “dry”); and confusing EC in source water with EC in substrate, which accumulates differently. Practical decision: define in advance the question each sensor answers (condensation? fast drying? uniformity?). Verification: record 2–3 daily visual observations and look for consistency between those notes and the sensor trends.
4) Placement: edges vs center, leaf level vs soil level
In protected structures, edges often have a different regime: drafts, radiation differences, heat loss, and infiltration. That is why a “reference” sensor in the center plus one at an edge immediately builds a practical mental map of uniformity. At canopy level, mount the sensor in the active crop zone, protected from direct spray and leaf contact, but low enough to capture the canopy air layer. In soil, the sensor must sit in the rooting zone, not below a drainage layer.
What to observe: whether differences in humidity/temperature widen at certain hours (early morning for condensation, afternoon for drying). What to verify independently: spot-check temperatures with a simple thermometer, inspect airflow paths during venting, and see whether film/shading creates “cold shadows.” Practical decision: adjust ventilation or screening by zone, or rebalance irrigation distribution across branches. Check the result: after the intervention, the center–edge gap should drop repeatedly at the same time windows, not only once.
5) A 7-step commissioning protocol for a short-cycle crop
Step 1: define zones (for example center, cold edge, warm edge, door end) and objectives (uniformity, less condensation, finer irrigation). Step 2: verify units and reporting interval; for lettuce-type decisions you need data freshness good enough to capture night/day transitions and post-irrigation dynamics. Step 3: install sensors and document exact position, height, and orientation so later comparisons are meaningful.
Step 4: run a 24-hour sanity check: values should follow basic logic (cooler nights, local humidity rises after irrigation) without stuck readings or impossible jumps. Step 5: run an operational test—a short irrigation event and a planned venting event—and track the response in each zone. Step 6: set provisional, wider thresholds/alerts to avoid false alarms until patterns are understood. Step 7: after 7–10 days, adjust placement or thresholds based on persistent differences, not on one spike.
6) Irrigation: using soil/substrate moisture for fine dosing
For leafy greens, the practical target is stability: large swings between “very wet” and “too dry” create unevenness, especially in light substrates or soils with variable structure. In data, watch the drawdown rate between irrigations, the depth where moisture stabilizes, and differences between zones/branches. A sudden drop can indicate a sector that is not watering, clogging, or an area with weak rooting—problems that can look like “heat stress” if you only watch air temperature.
What to verify independently: perform a dripper flow check, visually inspect wetting in the profile (a small test section), and verify line pressure. Practical decision: adjust duration/frequency in small steps and, when needed, correct distribution (branches, filters, pressure) rather than only applying “more water.” Check the result: after 2–3 irrigation cycles, the moisture curve should show similar recovery across zones and a more comparable drawdown slope; if not, it is a uniformity problem, not a scheduling problem.
7) Condensation, ventilation and VPD: linking data to dry leaves
Condensation forms when leaf temperature or canopy air temperature drops toward the dew point. In dense crops, humid air can remain under the canopy even if conditions “up high” look acceptable. What to track: hours with very high RH, rapid temperature drops after sunset, and repeated stagnant-air episodes. VPD (from air T/RH) helps you identify windows with very low atmospheric demand (wet-leaf risk) or very high demand (rapid-drying stress). Remember: it is an estimate; leaf temperature can differ from air temperature.
What to verify independently: look at leaves before sunrise and after venting, check for droplets on the cover film, and note whether outside wind pushes cold air into specific corners. Practical decision: use short, targeted venting pulses to break the humid layer without overcooling the canopy; sometimes repeating a small action is more effective than one large opening. Check the result: over the next mornings, the duration of very high humidity episodes should shorten in the problem zone, and the gap versus the center should reduce.
8) Data, alerts and quality control: avoiding decisions on wrong values
A connected system is only useful if data are credible and fresh. Monitor sensor status (battery, signal, “frozen” values) and always correlate with what you see in the structure. Typical failures include: an air-humidity sensor accidentally wetted and stuck “high,” a soil sensor partially pulled out and reading air, or long transmission delays that shift an event (like irrigation) to the wrong timestamp. In these cases the cause looks agronomic, but it is technical.
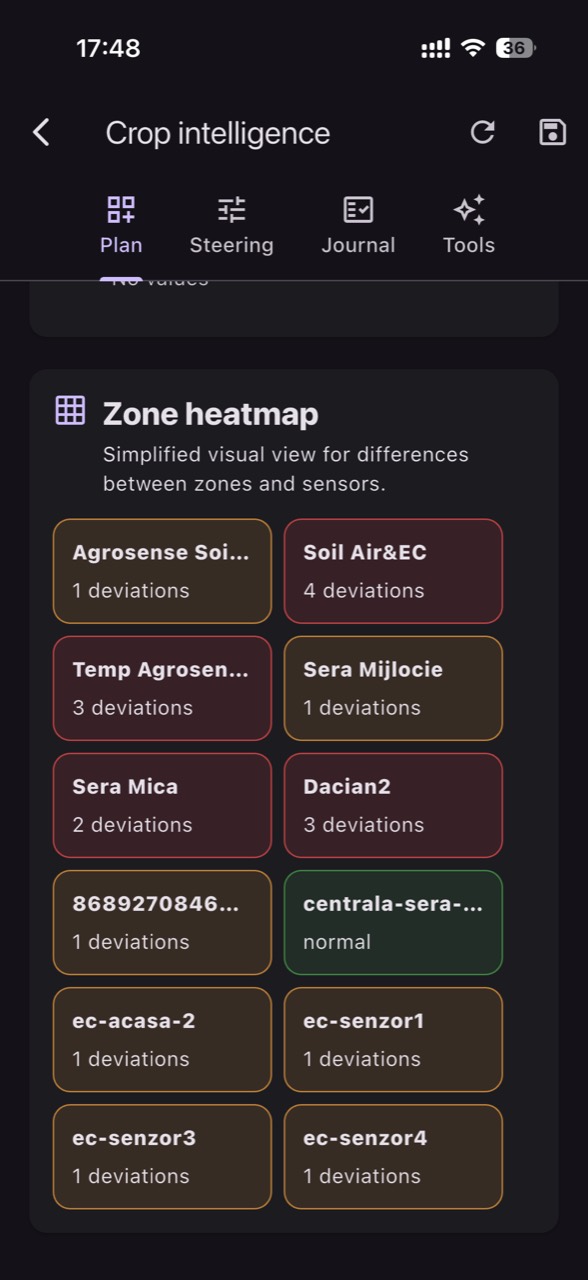
Practical decision: set a weekly audit routine—compare sensors across zones, look for persistent deviations, and physically verify installation. If you use GrowGuard, you can organize zones and alerts so you see edge-versus-center differences and receive notifications when a deviation is meaningful rather than for every minor fluctuation. Check the result: after corrections, alerts should become rarer but more “true,” and interventions should show a visible effect in trends and in the visual uniformity of the leaves.
Conclusion
Leafy greens demand a difficult combination: a dry leaf surface with a steadily supplied root zone, inside a structure where microclimate can change over meters, not hectares. The key is to understand mechanisms (condensation, atmospheric demand, water distribution), measure at representative points, and independently validate any signal before changing routines. With short cycles, fast commissioning is the difference between “lots of data” and repeatable decisions.
A good workflow does not start from universal setpoints; it starts from clear questions: where does condensation form, which zone dries first, which sector irrigates unevenly, and how does the crop respond after a correction? If you want to track those zone differences and discuss them easily with your team, GrowGuard can be used as a monitoring and alerting platform—while the rest remains agronomic discipline: observe, verify, decide, and confirm the outcome.