LoRaWAN is worth considering when you need many battery-powered measurement points spread out where wiring is expensive or fragile: multiple tunnels, fields with micro-relief, orchards with exposure differences, or greenhouses with compartments. But the same traits that make it attractive (infrequent data, small packets, radio) can also produce wrong conclusions if you don’t understand the data path and measurement limits.
In horticulture, the most damaging “problems” are the ones that don’t exist: you start irrigation because a soil sensor suddenly reads “dry” when it actually lost soil contact; you open ventilation because VPD looks high, but the sensor is sunlit; you suspect disease because relative humidity is high even though the leaf stayed warm and dry. LoRaWAN doesn’t fail by itself, but poor placement and validation create errors.
This article is a diagnostic guide: when LoRaWAN fits (and when it doesn’t), how data truly moves from sensor to platform (including servers and MQTT), how to split a farm into crop zones, and—most importantly—how to compare microclimates without falling into deceptive readings. Each situation includes the mechanism, what you observe, what to verify independently, a practical decision, and how to confirm the result.
1) When LoRaWAN fits—and when it gets in your way
LoRaWAN fits when you need long autonomy and good coverage for short messages: air temperature/humidity, soil moisture, level, contact, and flow pulses. It is less suitable when you need continuous streams, low latency, or large payloads (for example, images), or where dense metal structures heavily block radio. In greenhouses, zone-to-zone comparisons are valuable—but only if placement is stable and the data is fresh enough for the decisions you are making.
Signs that LoRaWAN is “getting in your way” show up when decisions are driven by isolated points: one soil probe representing a large sector, an air sensor placed near a door, or a device that reports very rarely. Independent verification starts with: is the problem physiologically plausible? Midday wilting, for instance, can be real water stress, but also stomatal closure under high VPD. Practical decision: treat LoRaWAN primarily as a trend and zone-comparison tool, then validate in the crop before costly interventions.
2) How data reaches GrowGuard (and where truth can be lost)
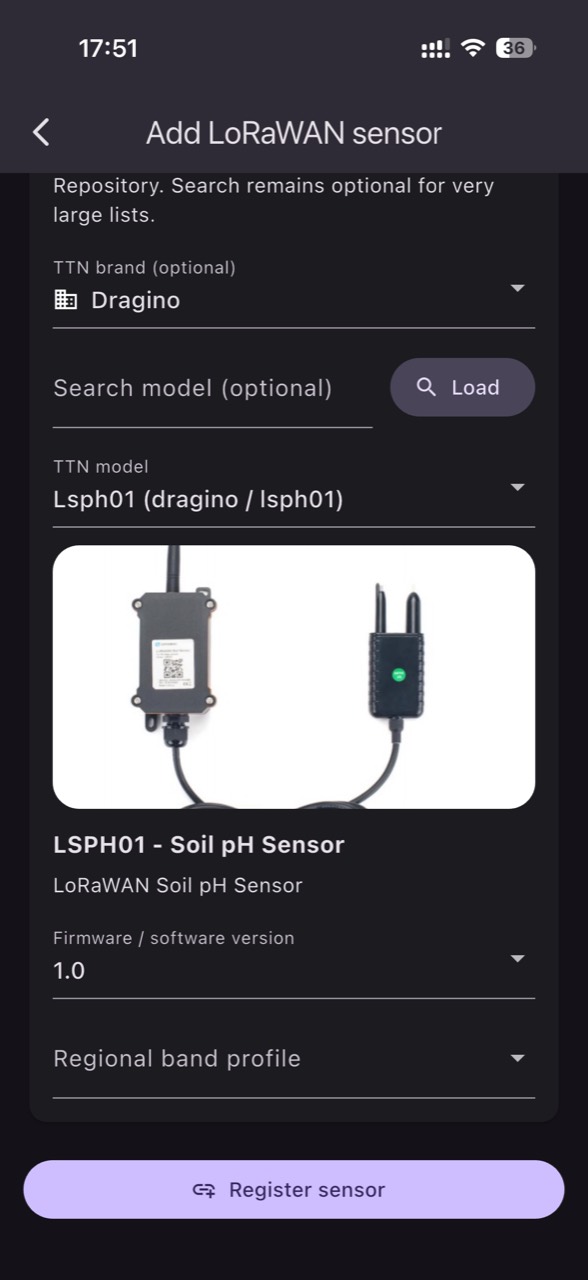
In LoRaWAN, the sensor (end-device) transmits radio packets to one or more gateways. The gateway does not interpret agronomy; it forwards data to a network server and then an application server. Only there is the payload decoded into quantities and units (for example °C, %RH, kPa, m³/m³), and applications then consume the data. A common integration path is that The Things Stack exposes application data via MQTT; the key distinction is that LoRaWAN is the radio network, while MQTT is an application-layer messaging protocol—not an alternative for radio coverage.
When diagnosing a suspicious reading, the data path helps you separate three problem classes: measurement (sensor), transmission (radio), and interpretation (decoding/units). What you may observe: sudden jumps, missing periods, “capped” values, or sign inversions. What to verify: the timestamp of the last uplink (data freshness), the reported signal indications, unit consistency after decoding, and whether the same event appears in multiple zones. Decision: if you have latency or missing packets, don’t treat the last value as “now”; confirm with a quick local measurement and later check the historical trend to see if it was real.
3) Air sensor placement: why VPD and humidity can “lie”
In protected cropping, air is not uniform: you get stratification, fan jets, thermal screens, door effects, and condensation pockets. A temperature/RH sensor placed in direct sun, near heated plastic, or in strong airflow will report an artificial microclimate. VPD computed from air temperature and relative humidity is an estimate; the leaf may be at a different temperature, so the plant’s real evaporative demand can differ. In tomatoes, peppers, or cucumbers, VPD-driven responses (transpiration, pollination quality, flower abortion) can amplify a wrong interpretation.
What you observe: VPD “explodes” at midday at only one point while the rest of the zone does not show the same pattern; RH looks extreme, yet you see no real condensation on leaves or structure. Verify independently with a portable reading at the same position and with inspection: are leaves actually cool/wet, are droplets present, is there a persistent damp smell? Practical decision: relocate the sensor to canopy height, shielded from direct radiation and kept away from walls and localized drafts. Confirmation: after repositioning, compare curves over a few days between two points; differences should reflect real zones, not placement artifacts.
4) Soil/substrate sensors: contact, depth, and the irrigation footprint
Soil or substrate moisture sensors are sensitive to physical contact with the medium and to depth relative to active roots. In horticulture, roots often concentrate in the wetted layer; in substrates (coco, peat, rockwool) gradients can be fast. A probe sitting in an air pocket, in compacted material, or at the edge of the wetted bulb may report “dry” when the plant has water—or the reverse. Likewise, EC is medium-specific: EC in drain solution differs from EC in the root-zone volume, and a temperature sensor cannot replace an EC/pH probe; EC and pH require dedicated probes.
What you observe: after an irrigation event, one sensor shows little or no increase while others respond; or you see very fast oscillations that don’t match soil dynamics. Verify independently: dig locally to confirm moisture, check dripper uniformity, and—hypothetically—assess substrate moisture gravimetrically (weighing/squeezing) or with a handheld probe. Decision: reposition the probe into a representative wetting-and-root zone point, avoiding edges and preferential water paths. Confirmation: in the following days the curve should show coherent irrigation response and a gradual decline between events, not random “noise.”
5) Crop zones and microclimate comparisons: avoiding wrong conclusions
Correct comparison starts with zones: a greenhouse has at least end-vs-center differences, door-adjacent effects, wall effects, and heating/ventilation line influences; an orchard has slope, exposure, shading, and soil-type differences. If you mix sensors from different zones into one “average,” you lose the useful signal and risk treating a local issue as a general problem. Also, the same parameter matters differently across phenological stages: at flowering, microclimate affects fertilization; at fruiting, it can affect sizing and cracking risk, depending on the species.
What you observe: one sector runs colder at night and growth slows or color development lags; another sector holds higher humidity and leaves appear more tender. Verify independently: mark real boundaries in the field (irrigation layout, shading, screens, soil transitions), and compare two points that are close but separated by a true barrier (for example, a door). Decision: define crop zones that match infrastructure and micro-topography; in GrowGuard this means interpreting readings on a map and by zone, not as a flat list of numbers. Confirmation: after a targeted change (e.g., ventilation adjustment at one end), the difference between zones should reduce gradually—not jump arbitrarily elsewhere.
6) Network issue vs agronomic issue: latency, packet loss, and “the last point” trap
In LoRaWAN, packets can arrive late, go missing, or be duplicated; and depending on configuration, a device may report at long intervals to save battery. That creates a trap: the “last point” on a chart may be old but looks current. In horticulture, some decisions are time-sensitive (frost, heat spikes, ventilation actions); if data isn’t fresh, you react to the past. The mechanism is usually straightforward: weak radio links, obstacles, an underperforming gateway placement, or unsuitable confirmation settings.
What you observe: alerts that arrive late, jumps from one value to another with no transition, or data gaps exactly when weather shifts. Verify independently: each sensor’s last update time, correlation to a local reference (for example, a nearby thermometer), and whether multiple devices went silent simultaneously (pointing to network). Decision: for time-critical parameters, either increase reporting frequency, add redundancy in key zones (two sensors), or choose different connectivity for that specific task. Confirmation: after changes, watch a few fast-change episodes (hypothetically, a cold front) and check whether data arrives close enough to the real moment to support decisions.
7) Interpreting values: units, decoding, and sensor drift
A “correctly transmitted” reading can still be wrong if the payload is decoded with incorrect scaling or units. A sensor might send temperature in tenths of a degree, and a wrong decoder displays it ten times higher; a soil moisture sensor may report a relative index rather than volumetric water content. For EC, you must state the medium and method: EC in water/solution, in drain, or an estimate in soil; EC does not identify individual nutrient concentrations, and pH/EC require dedicated probes. Over time, some sensors drift or can “freeze” at a plausible-looking value.
What you observe: physically impossible values for the location, repeated identical step sizes (for example, exactly 10 units), or a perfectly flat line for days under variable conditions. Verify independently: compare with a reference instrument, do a two-point check (temporarily move the suspect sensor next to a known-good one), and note whether environmental changes are reflected. Decision: correct decoding/units in the integration, recalibrate if the manufacturer supports it, or replace the sensor with one suited to the medium (soil vs substrate). Confirmation: after correction, curves should show realistic amplitude and correlate with events (irrigation, ventilation, rainfall), rather than remain anomalous.
8) A commissioning protocol for microclimate comparisons (with result verification)
A simple, rigorous protocol reduces “misleading readings.” Start with a placement plan: for each important zone, deploy at least one air sensor and—where relevant—one soil/substrate sensor in a representative point. Then validate for several days: look for coherence among sensors within the same zone and explainable differences between zones. In parallel, check data freshness and that each variable is measured with the appropriate method (pH/EC using dedicated probes). The goal isn’t perfection; it’s early detection of bad installations before they pollute your diagnostics.
Next, build repeatable “reality tests” you run whenever you suspect a problem. Hypothetical example: if one greenhouse end is consistently colder at night, verify with a reference thermometer, inspect for air leaks, and compare to wind/forecast context. Decision: adjust insulation or heating regime for that end, not for the entire house. Result check: in history, the zone difference shrinks specifically in the affected interval (night), and crop uniformity improves gradually. In GrowGuard, you can track these comparisons by zone and receive sensor status alerts when a device stops being trustworthy—before it undermines your diagnosis.
Conclusion
LoRaWAN is valuable in horticulture when you treat it as a complete system: correct measurement, representative placement, sufficiently fresh data, and zone-based interpretation. Most “false alarms” come from artificial microclimates created by mounting (sun, drafts, walls), poor contact in soil/substrate, or confusion between network problems and real crop problems. Before changing irrigation, ventilation, or fertilization, confirm in the crop and look for coherence across multiple points.
If you want to turn these principles into a diagnostic routine, define zones and compare microclimates systematically, then validate with direct plant observations and reference measurements. For consistent monitoring and interpretation of LoRaWAN sensors by map and zone, you can use GrowGuard—start with a small, well-commissioned set and expand only after you trust the data.