In melon production, uniformity is lost quickly when water arrives late or unevenly. The paradox is that once you install sensors, you can make wrong decisions faster: a probe placed too close to a dripper can look “perfect,” while the adjacent row suffers. That’s why good monitoring starts by validating the measurement, not by changing the irrigation schedule.
In the field, microclimates are not just “temperature differences.” A slight slope, a windy strip, or a patch with different soil texture changes evaporation, infiltration, and leaf-level temperature. In melons, that often shows up as uneven fruit set, variable size, and ripening in waves. Data only helps when it is comparable between zones.
This article is a diagnostic guide: how to distinguish a real crop problem (water stress, salinity, weakened roots) from a misleading reading (poor placement, misunderstood units, a stuck sensor, or network issues). For each situation you’ll get the mechanism, what to observe in the field, what to verify independently, a practical decision, and how to check the result—especially by comparing zones and microclimates.
1) Know what you’re measuring: “water in soil” isn’t the same everywhere
Melons have active roots in the worked layer and within the wetted zone created by drip irrigation, and fruit responds to fluctuations: too dry between irrigations slows growth, while constantly wet conditions encourage shallow roots and higher heat sensitivity. Soil moisture/EC sensors describe only the soil volume around them, not “the whole field.” If that volume doesn’t represent the root zone, your diagnosis will be wrong.
Always verify the medium and the method: EC in fertigation solution is not the same as EC from a soil extract or EC measured in bulk soil. Likewise, water pH is not soil pH. A temperature sensor cannot indicate EC/pH; those require dedicated probes. For independent verification, use a wetting-pattern inspection (a small control pit) and periodic water/soil analysis; on-site pH/EC monitoring complements, not replaces, laboratory work.
2) Soil sensor placement: how to avoid the “pretty reading” next to the dripper
In melons, distance from the drip line and depth can be the difference between a useful sensor and one that misleads you. Too close to the emitter, you’ll see big spikes immediately after irrigation and assume you have “reserve,” while the active zone between plants can remain dry. Too far away, the sensor may read dry all the time and push you toward over-irrigation. The underlying mechanism is uneven water distribution in soils with variable porosity.
A practical protocol: choose a representative point for the zone, dig a section after a typical irrigation, and observe the wetting front. Install the probe in soil that matches root density and the “core” of the wetted bulb, not its edge. Record distance from the emitter and depth. Decision: if the sensor shows rapid saturation but leaves wilt at midday, move the point or add a second probe. Check results by comparing the curve between irrigations: you should see steady depletion, not only spikes.
3) Crop zones: when one station ruins your entire strategy
Uniform melons require managing differences between the end of an irrigation sector and the middle, between sandy and heavier patches, and between the top of a slope and its base. If you treat the whole field as one block, a sensor in a “good spot” can validate an irrigation that is insufficient elsewhere. Mechanisms include pressure differences along the tape, different infiltration rates, different evaporation demand, and sometimes local root damage from compaction or prior waterlogging.
Define 2–4 zones before multiplying sensors: zone by soil type, elevation/slope, wind exposure, distance to the water source, and problem history. Then place “reference” sensors in each zone rather than clustering them together. Decision: adjust irrigation duration/frequency by zone (if sectors are separate), or if you can’t, at least choose a strategy that doesn’t punish the most sensitive zone. Verification: zone differences should shrink in crop growth rhythm and fruit uniformity—not only on charts.
4) Microclimates: compare air conditions, but remember the leaf can be a different temperature
In melons, transpiration and leaf cooling influence how fast water is drawn from the root zone. Two locations with the same “station temperature” can have different stress if one is wind-exposed or receives more radiative load (for example, light-colored soil or plastic mulch reflecting heat). VPD calculated from air temperature and relative humidity is an estimate; leaf temperature may be higher or lower, so real demand can differ.
What to observe: repeated wilting at the same hours, smaller leaves in one zone, slower fruit growth at the same fruit age. What to verify independently: a simple wind check (even a basic handheld measurement) and a spot-check of leaf temperature with an IR thermometer (hypothetical verification, not a setpoint), plus correlation with soil moisture. Decision: shift irrigation timing to match daily demand (for instance, earlier in a windier zone) or apply stress-reduction measures (mulch, canopy/vegetation management). Verify by reduced wilting amplitude and steadier depletion curves between irrigations.
5) When the sensor “says drought,” but the issue is roots or distribution
A low soil-moisture reading can mean three different things: you truly lack available water, water isn’t reaching that point because distribution is failing (partially clogged emitters, low pressure at the end), or the root system is no longer extracting well (oxygen stress after waterlogging, mechanical injury, excessively hot surface layer). The common mechanism is a decoupling between “water applied” and “water accessible” to the plant.
What to observe: plants stressed in stripes along the drip line, or “islands” of stress under the same irrigation event. What to verify: a field check using a measuring cup/container at several emitters for relative flow, visual inspection of filtration and pressure difference, plus a control pit to confirm wetting depth. Decision: if distribution is the issue, correct filtration/flushing and rebalance the sector; if roots are the issue, reduce oscillations and avoid irrigations that keep soil airless for too long. Verification: after the fix, the problem zone’s moisture curve should resemble the “good” zone more closely and growth should resume.
6) When the sensor “says too wet,” but plants look thirsty: false reading vs. salinity
You can see high moisture yet still get stress symptoms because plant-available water effectively decreases when salinity rises in the root zone. In melons, alternating short irrigations with strong evaporation can concentrate salts at the wetted-bulb margins. If you also monitor soil EC (same measurement medium and comparable depth), rising EC alongside “adequate moisture” suggests osmotic stress rather than lack of water. EC does not tell you which ion dominates; it indicates total soluble salts.
What to verify independently: separate measurement of fertigation-solution EC and, when possible, confirmation via soil/substrate extraction or laboratory analysis so you don’t confuse measurement media. In water, pH, alkalinity, and soluble salts are different things; correcting pH does not automatically solve salinity. Decision: adjust irrigation strategy to reduce accumulation (for example, irrigations that rebuild a uniform bulb rather than repeated light “sprinkles”), and review the recipe only after confirmed data. Verification: root-zone EC stabilizes and symptoms (rigid leaves, slow growth) ease in the affected area.
7) Data problems: freshness, units, and “frozen” values
Many “alarms” are actually data issues. For irrigation, freshness matters: a value that is hours old can look like “drought” even though you irrigated, but transmission failed. Another trap is mixed units between sensors (volumetric percentage, tension, proprietary index) or thresholds set as if they were the same measurement type. A classic sign of a failing probe is a nearly constant value that doesn’t respond to irrigation or rainfall.
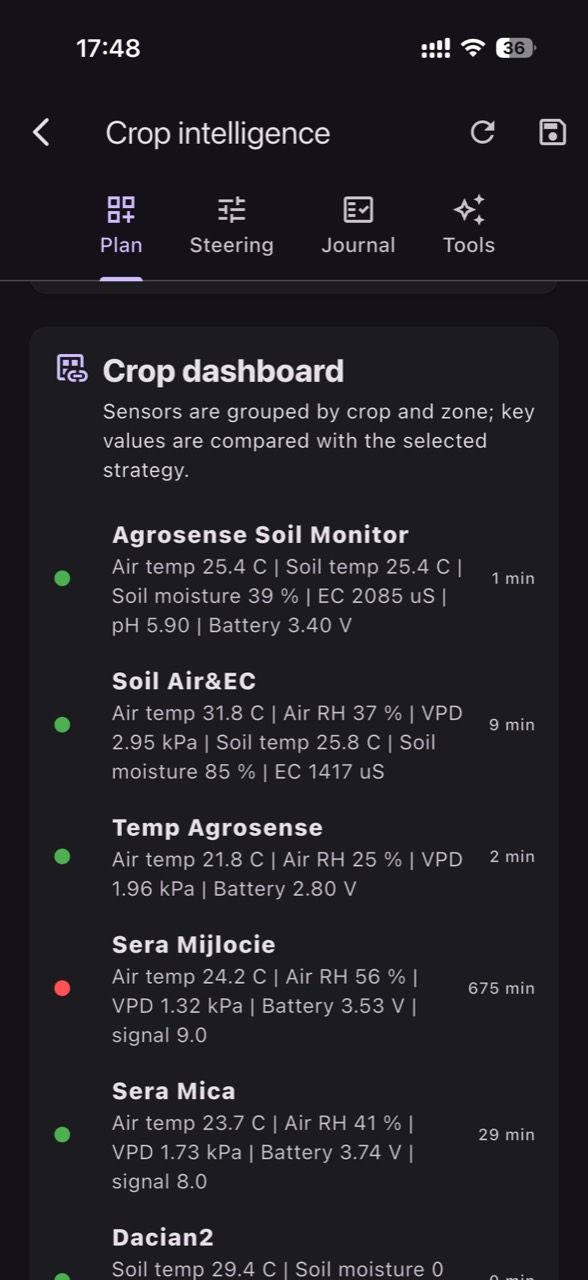
What to verify: match the time of the last update to real events (irrigation, rain, shutdowns), look for step changes after irrigation and a clear downward trend between irrigations. Compare with a second point in the same zone: if one reacts and the other doesn’t, suspect the sensor, not the crop. Decision: before changing irrigation, check power, connections, and physical position (was it partially pulled out?) and run a short test irrigation. In GrowGuard, battery/status alerts can help separate a field problem from a connectivity issue, but the final confirmation is still in the field.
8) Comparing microclimates: deciding fast between agronomy and equipment
When you have two zones similar in soil and cultivar, differences between curves become a diagnostic tool. A warmer microclimate should show faster depletion and possibly more frequent irrigations; but if the difference appears suddenly after an intervention (filter flushing, tape moved, pressure changed), suspect equipment. Mechanism: distribution faults create discrepancies with “sharp edges,” while microclimates tend to produce gradual, time-of-day and wind-linked differences.
Protocol: pick a “control zone” that performs well and compare daily three things: soil moisture depletion between irrigations, immediate response after irrigation, and air conditions (temperature/humidity). Then perform a targeted independent check: 10 minutes of emitter flow comparison, a control pit, and row-by-row symptom inspection (linear pattern vs. patchy spots). Decision: if it’s microclimate, adjust timing and rhythm; if it’s equipment, repair first. Verification: after 24–48 hours (hypothetical), curves should converge in shape even if they don’t become identical.
Conclusion
Monitoring in melons is not about finding a single “correct number.” It’s about building a coherent picture: where the measurement is taken, which medium it describes, how fresh the data is, and how it matches field symptoms. With correct placement and well-defined zones, microclimate differences become explainable and manageable, and uniformity improves through consistency rather than reacting to spikes.
If you want to use data as a diagnostic tool, start with two contrasting zones, two well-chosen soil points, and a short post-irrigation verification routine. In GrowGuard you can follow zones on a map and watch status alerts, but the best decision is still the one confirmed by a simple field check. For more reliable commissioning, have your team document each sensor’s placement and the reason it was chosen.