Uniformity in melons (size, shape, sugar accumulation, and ripening timing) can be lost quickly when the root zone swings between water deficit and excess. The plant responds with interrupted growth, flower abortion, uneven fruit sizing, and higher sensitivity to sunburn, cracking, or quality problems at harvest. That’s why monitoring must follow water dynamics in the soil—not just the irrigation calendar.
In the field, melons can develop roots that explore large soil volumes, but the most active roots still remain where the soil is aerated, warm, and nutrients are available. When irrigation fills pores with water, oxygen drops and roots effectively “close the tap.” When soil dries abruptly, plants enter stress and formed fruits stop expanding uniformly. Good monitoring shows where you are on that curve.
A useful monitoring system doesn’t start with “universal thresholds.” It starts with commissioning that confirms sensors see the same reality as your field soil. Then you build a workflow: what you observe in the data, what you verify independently in the field, what decision you make (duration, frequency, sectors), and how you check the effect over the next 24–72 hours. That is the frame of this article.
1) Why melons lose uniformity: growth rhythm and the “memory” of stress
Melons are sensitive to alternation: a deficit period followed by heavy irrigation can abruptly change internal tissue pressure, and fruits may end up with “stepwise” growth. In early stages, stress affects viable flowers and fruit set; later, it affects size and quality. The mechanism is straightforward: under stress, stomata close, photosynthesis drops, and the carbohydrate flow to fruit becomes uneven, which is hard to fully recover within the same harvest window.
What to observe: the soil-moisture trend in the active root zone before and after irrigation, plus air temperature and relative humidity (which drive water demand). What to verify independently: leaf condition during hot hours, soil consistency at root depth, and flow uniformity along the row. Practical decision: don’t try to “fix” a large deficit with one long irrigation without checking internal drainage first. Result check: next day, the moisture curve should show stabilization, not sharp spikes followed by steep drops.
2) What to measure in soil: volumetric water content vs. tension, plus temperature
For irrigation, two families of measurements are common: volumetric water content (how much water is in a soil volume) and water tension (how hard the plant must pull to extract water). They are not interchangeable and must be interpreted differently, especially where soil texture varies within a field. Volumetric moisture is intuitive for irrigation dynamics; tension is closely linked to “availability” from the plant’s perspective and responds strongly to texture and structure.
What to observe: how the sensor reacts to a short irrigation (a rapid increase), then the slope of decline (uptake plus drainage). Soil temperature adds crucial context: in cool soil, uptake is slower and roots are less active, so the same moisture value can correspond to a different level of plant comfort. What to verify independently: a small hand auger hole or probe to see wetting depth and whether a compacted layer exists. Decision: choose sensor type based on soil and goal (trend tracking vs. stress indication). Check: compare the sensor’s evolution with field observations and a controlled “test irrigation.”
3) EC and pH: the difference between source water, fertigation solution, and soil
In melons, uneven production can also come from salinity: the soil may contain water, but part becomes effectively “unusable” when soluble salts rise, pushing the plant into osmotic stress. EC helps here, but it must be stated clearly: EC does not tell you which nutrient is missing and it does not measure specific toxins; it indicates total soluble salts in the measured medium. And the medium matters: source water, fertigation solution, soil/substrate extract, and bulk soil are different measurements.
What to observe: EC of irrigation water (water quality), EC of fertigation solution (what you apply), and separately the root-zone EC using a consistent method (for example, periodic soil samples analyzed the same way, or a dedicated soil EC approach if you use one). pH must be interpreted similarly: water pH is not soil pH, and alkalinity affects pH stability over time. What to verify independently: laboratory water analysis and soil tests; on-site pH/EC monitoring complements laboratory analysis, it does not replace it. Decision: adjust leaching or fertigation splitting strategy and track whether root-zone EC returns to a level aligned with local guidance. Check: after 1–3 irrigation events, look for EC reduction using the same sampling method.
4) Sensor choice for melons: what matters in the field, not in a brochure
For an open-field drip-irrigated melon crop, a functional minimum set is: a soil moisture sensor (or tensiometer) plus an air temperature and humidity sensor to interpret evaporative demand. If you fertigate regularly, add dedicated pH/EC monitoring in the water or in the solution at line end; a temperature sensor does not measure EC or pH. For good decisions, repeatability and stability of readings usually matter more than collecting a long list of parameters.
What to evaluate when selecting: compatibility with your soil type (including sensitivity to salinity and the need for good soil contact), tolerance to installation errors (air gaps), reporting interval and data freshness (if you receive old values, you’ll “irrigate in the past”). What to verify independently: response testing (short irrigation and observing the change), plus periodic checks of cable integrity and sensor position in soil. Decision: prioritize one or two well-chosen, validated points before expanding the network. Check: confirm that sensors in the same zone tell the same story, even if absolute values differ slightly.
5) Placement by depth and by zones: capturing the wetting front
A common mistake in melons is monitoring too shallow or in a “too perfect” spot (for example, next to an ideal dripper), then assuming the whole field behaves the same. Drip irrigation creates a wetting bulb; active roots concentrate where there is both water and oxygen. If you want uniformity, you must see whether moisture reaches the effective root zone and whether differences appear between the start, middle, and end of a line—or across soil transitions in the same field.
What to observe: at least two depths at the same point—one in the active root zone and one slightly deeper as a “guard” to detect irrigation that moves beyond the useful zone and is lost to deep percolation. What to verify independently: small digs after an irrigation (hypothetically on a calm day) to view bulb shape, plus checking emitter flow at several points. Decision: if the deeper sensor shows big increases at every irrigation, shorten runtime and increase frequency, or adjust sector scheduling. Check: within 48 hours, the guard depth should show stability rather than progressive accumulation.
6) A 7-step commissioning protocol: from installation to usable thresholds
Commissioning means proving the chain “soil–sensor–data–decision” works. Practical steps: (1) describe the zone (texture, slope, water source, drip layout); (2) choose one representative point and one “problem” point (row end, sandier/heavier patch); (3) install sensors with good contact, no air pockets; (4) record depths and distance to dripline; (5) confirm signal and reporting interval; (6) run a test irrigation and track the response; (7) set provisional thresholds based on trends, not absolute numbers.
What to watch during validation: data freshness (time from measurement to display), “stuck” values (unchanged for hours), impossible jumps, and differences between nearby sensors that lack an agronomic explanation. What to verify independently: an irrigation log (start/stop times), line pressure, and if available a water meter per sector. Decision: don’t automate irrigation from sensor data until you’ve completed at least 2–3 tested, confirmed irrigation cycles. Check: after adjustments, curves should become repeatable day-to-day under similar weather conditions.
7) How to make daily decisions: from curves, not from a single number
A daily workflow for melons starts in the morning with weather context (evaporative demand) and the last 24 hours of history. Look at the baseline before the first irrigation, the rise amplitude after watering, how quickly the curve returns to a downward slope, and whether the soil “holds” water overnight or drains away. Mechanistically, if internal drainage or deep percolation dominates, you’ll see a fast drop even when plant consumption is modest. If stress dominates, the drop accelerates in peak heat.
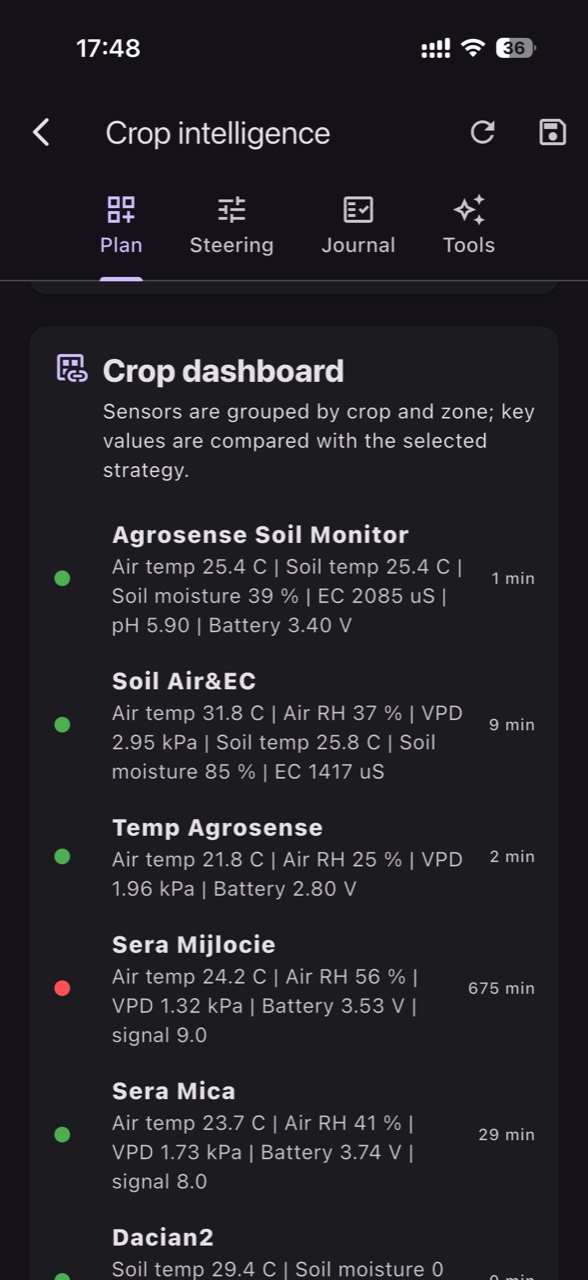
What to verify independently: a quick midday plant inspection (turgor, leaf behavior, perceived heat), plus checking irrigation uniformity on a few lines. Decision: adjust timing (earlier/more frequent), duration (shorter), or sectoring (different zones treated differently). Check: evaluate “the next day.” If you increased frequency, daily oscillation should shrink; if you reduced runtime, the guard-depth sensor should show fewer peaks. In GrowGuard, you can review curves by crop zone and set soil-moisture alerts so a drying sector is not missed.
8) Typical failure cases: when data can mislead you and how to dismantle it
Several situations can quietly degrade uniformity through wrong interpretation. (a) A sensor installed into an air gap reads too dry and pushes you toward overwatering. (b) A sensor placed too close to a dripper reads too wet and hides deficit between lines. (c) Drift or poor contact after mechanical work changes the curve without a real agronomic cause. (d) Delayed data leads you to react to yesterday’s conditions. The shared mechanism is decision-making based on a signal that no longer represents the active root zone.
Alarm signs to watch: no response to irrigation, an inverted response (reading drops when you irrigate), or large differences between nearby points with no soil explanation. What to verify independently: physical re-inspection of the sensor, a small dig, emitter flow and pressure checks, and a comparison against a secondary tool (for example, a portable tensiometer or a soil sample). Decision: before changing the irrigation recipe, validate the sensor and irrigation hardware. Check: after correction, the curve should again align coherently with irrigation events and field observations.
Conclusion
Monitoring irrigation in melons is not about collecting many values; it is about controlling variation in the root zone and tying it to decisions you can verify. If you understand how the wetting front moves, how salinity (EC) evolves in the specific medium you measure, and how weather shifts water demand, you can build irrigations that support steady growth and, in turn, more uniform harvest outcomes.
A platform such as GrowGuard helps most when you work by zones, need alerts, and want clear history to compare weeks with different weather, but the real value comes from commissioning and independent checks. If you want, use this article as a working checklist to commission sensors in 1–2 days and stabilize decisions in the first week of use.