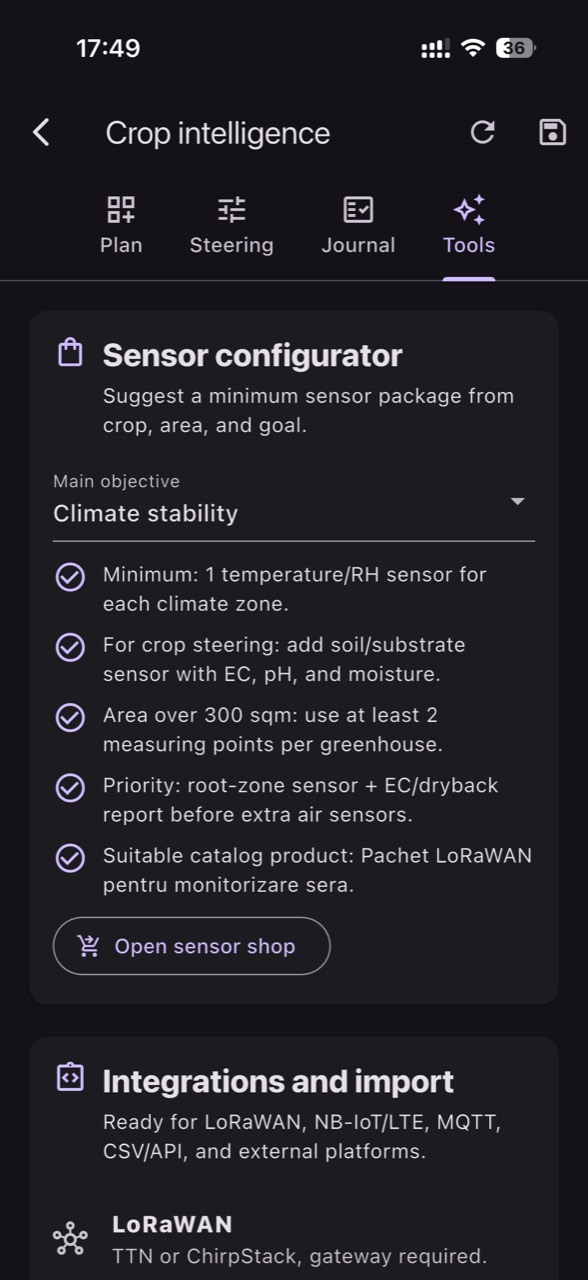
Microclimate monitoring is not just “having some numbers.” It means measuring in the same medium that matters to the plant, at points that truly represent the crop zone, with clear units and a sampling rhythm that fits the dynamics you want to manage. Otherwise, data becomes noise: false alarms, delayed reactions, and comparisons between places that are not actually comparable.
In greenhouses and tunnels, microclimate fragments quickly: vertical stratification, cold corners, drafts near doors, different humidity near screens and heat sources. In orchards and field blocks, terrain, exposure, wind, and soil type create temperature, humidity, and water-availability differences over short distances. Sensor placement should capture these mechanisms, not “average them away.”
This article provides a complete commissioning workflow: from defining the objective and selecting sensor types to placement, independent verification, and decision-making. For each issue, we explain the mechanism, what to watch, how to confirm with a separate check, a practical decision you can take, and how to verify that the intervention produced the intended effect.
1) Start with the right question: which decision must the data support?
Before you buy or mount sensors, define the decisions that depend on microclimate: ventilation, shading, heating, frost protection, irrigation planning, labor scheduling, or spray windows. The mechanism is straightforward: microclimate drives transpiration, evaporative cooling, leaf drying, and root-zone dynamics. If you don’t know what you want to trigger or avoid, you will measure many variables and act on very few—often too late, or for the wrong reason.
What to observe: variability by zone and by moment (night/day, after irrigation, after venting, after rain). What to verify independently: spend a week confirming, by field observation, where differences are “felt” (condensation, wet leaves, wilting, uneven ripening). Practical decision: pick 2–3 primary indicators per crop/objective, not ten. Result check: after an intervention, look for coherent trend changes, not a single “better” instant reading.
2) Choose the measurement medium and units: air, soil, substrate, water
A common failure is comparing measurements that are not from the same medium. Air temperature and relative humidity are air measurements; soil moisture is a root-zone measurement; EC and pH require dedicated probes and the method matters. EC in irrigation water, in fertigation solution, in a substrate extract, or in bulk soil are different measurements and cannot be interpreted the same way. A temperature sensor does not measure EC or pH.
What to observe: the displayed units and the method/medium (for example, EC in mS/cm in a specific solution or extract). What to verify independently: for water and nutrition, laboratory analysis clarifies pH, alkalinity, and total soluble salts; on-site pH/EC monitoring complements lab work, it does not replace it. Practical decision: label each probe by what it measures and where: “EC in fertigation solution” versus “EC in substrate extract.” Result check: after corrections, confirm the correct medium changes (root-zone EC, not just reservoir EC).
3) Mapping greenhouse microclimates: where uniformity breaks first
In protected structures, microclimate changes over small distances due to air movement, radiation differences, and stratification. Mechanism: warm air rises, cold air enters through openings, and cold surfaces (film, glass, metal members) encourage condensation. One sensor “in the middle” can look fine while the edges struggle. Placement by real zones is often more valuable than a single average value.
What to observe: persistent differences between ends, near doors, near walls, under vents, and at different heights (leaf level versus above the canopy). What to verify independently: an early-morning walkthrough for condensation marks and wet leaves confirms critical zones. Practical decision: place at least one reference point in a “representative” zone and one in a “risk” zone (cold/wet corner). Result check: after ventilation or heating adjustments, the gap between zones should shrink in the trend, not only during brief peaks.
4) Field blocks and orchards: terrain, wind, and soil effects on readings
Outdoors, microclimate depends on local elevation, exposure, cold-air drainage, and obstacles. Mechanism: at night, cold air “flows” into low spots; by day, wind and radiation change evapotranspiration; sandy soil dries differently than clay. If a sensor is placed only where it is convenient, the data will represent the road edge, not the block. In orchards, the canopy adds another layer through shading and retained humidity.
What to observe: where the first symptoms appear under thermal or water stress (for example, wind-exposed edges, frost-prone depressions). What to verify independently: spot manual measurements (handheld thermometer, portable moisture probe) in 3–5 points at the same hour, over several days. Practical decision: define management zones (high/low, different soil, exposed rows) and allocate sensors to each zone that changes decisions. Result check: after irrigation or frost measures, the monitored zone should respond in a way that matches on-the-ground observations.
5) Placing air sensors: height, shielding, and interference
Air temperature/RH sensors must measure the air the plant experiences, not air distorted by direct radiation or equipment. Mechanism: sunlight warms the housing and can overestimate temperature; fan jets or heating pipes can bias readings. In greenhouses, distance to foliage matters: too close to wet leaves can overestimate local humidity, too high can miss the active transpiration zone. Good placement reduces measurement artifacts before you try to interpret physiology.
What to observe: rapid jumps correlated with direct sun, a fan starting, or doors opening. What to verify independently: temporarily compare with a handheld instrument placed next to the sensor in shade for a few minutes; if the difference collapses, the placement was likely the issue. Practical decision: mount at leaf-zone height, protected from direct sun (with appropriate shielding) and away from heat/draft sources. Result check: after relocation, the daily curve should look more “physiological” (fewer artificial spikes) and align better with crop condition.
6) VPD: useful, but only an estimate—and only with clean inputs
VPD is derived from air temperature and relative humidity and indicates how strongly air can pull water from the plant. Mechanism: when air is warm and dry, VPD increases, transpiration intensifies, and stress can develop if roots cannot supply water fast enough. However, VPD is an estimate: leaf temperature can differ from air temperature, especially under strong radiation or cold drafts. Treat VPD as a decision aid, not an absolute truth.
What to observe: episodes where VPD rises quickly (after sunrise, after vent opening) and whether they coincide with signs of stomatal closure or wilting. What to verify independently: inspect leaves (turgor, edge scorch, “tight” foliage) and check root-zone moisture; high VPD without symptoms can mean the plant is compensating well. Practical decision: use VPD to time ventilation or shading, but validate with crop observation. Result check: after changes, aim to shorten the duration of extreme episodes rather than forcing a fixed number.
7) Root-zone moisture and EC/pH: depth, representativeness, and method
For soil/substrate moisture, the biggest mistake is incorrect depth or placing the sensor where water distribution is atypical (near a faulty dripper, at the edge, in a depression). Mechanism: active roots occupy a certain volume; too shallow and you react to surface evaporation, too deep and you see a sluggish signal and delay decisions. For EC/pH, remember: you need dedicated probes, interpretation depends on method and medium, and EC does not tell you the concentration of each nutrient.
What to observe: the response to irrigation (how fast moisture rises and how fast it returns) and whether salinity drifts over time. What to verify independently: controlled digging (tactile moisture check), samples for soil/substrate extracts, or spot manual readings; for water, lab analysis helps separate pH, alkalinity, and soluble salts. Practical decision: install in the active root zone and mark the exact point so you can replicate and troubleshoot. Result check: after changing irrigation/fertigation scheduling, trends should show coherent pulses and recoveries, not “stuck” values.
8) Commissioning and maintenance: data freshness, errors, and the reality test
A good monitoring design becomes useless if data is stale or if the sensor reports “plausibly” but incorrectly. Mechanism: weak batteries, signal problems, drift over time, or poor installation create latency, constant values, or biased readings. In commissioning, verify the last transmission time, unit consistency, plausibility (for example, perfectly constant RH all day), and response to a real event (ventilation, irrigation). Data quality checks are part of agronomy, not just electronics.
What to observe: gaps in data, improbable jumps, identical values for days, disagreements between two nearby sensors. What to verify independently: a controlled “perturbation test” (hypothetically, open vents for 10 minutes or irrigate one sector) and confirm the sensor reflects the change within its reporting interval. Practical decision: set a weekly status review and a monthly field-validation routine. If you use GrowGuard for monitoring, status and battery alerts can help catch failures early. Result check: keep an intervention log and confirm each action leaves a signature in the data; if not, suspect placement or sensor integrity before changing practice.
Conclusion
A successful monitoring project starts with defining zones and choosing the correct measurement medium, then continues with careful placement and rigorous commissioning. When you understand the mechanisms—radiation, drafts, cold-air drainage, root distribution—you know where to place sensors and what patterns to expect. When you verify independently, you avoid decisions based on distorted data.
To make these checks easier to repeat, a platform such as GrowGuard can help you follow sensors by zone, history, and status alerts, without confusing monitoring with automation. The closing invitation is simple: treat sensor installation like a technical commissioning task, not an accessory, and your data will become actionable.