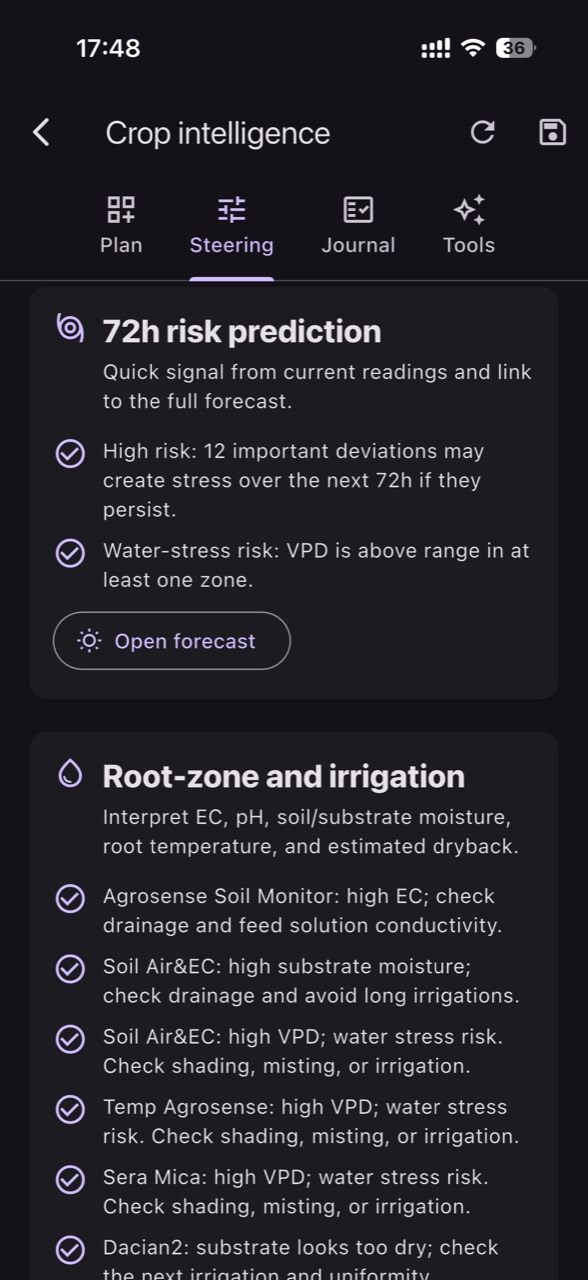
In commercial pear orchards, the same intervention can work in one block and fail in another, even when they are only a few hundred meters apart. Differences in soil, wind exposure, slope, and phenology create microclimates that change both water use and how long leaves stay wet. Sensors can clarify these differences, but only when they’re placed and interpreted correctly.
The most expensive mistakes happen when a sensor “looks bad” and the team reacts without confirming whether the value reflects the crop or just the sensor’s location or installation. In pear orchards, active roots can concentrate in the drip-wetted volume; if the probe isn’t in that volume, it reports a different reality. Likewise, a yard weather station can completely miss frost in a low block.
This guide is diagnostic: how to distinguish a real crop problem (water stress, climate risk, conditions favorable to disease) from a misleading reading (poor placement, sensor drift, delayed data, local shading). For each situation you’ll see the mechanism, what to observe in the orchard, what to verify independently, a practical decision, and how to check afterward whether your intervention actually worked in the right block.
1) Split the orchard into zones before choosing a “representative point”
Mechanism: in pears, differences in vigor and phenology between blocks translate into different transpiration and different sensitivity to stress, especially around fruit set and early fruit growth. That’s why a single “average” sensor can drive wrong decisions. What to observe: areas that start earlier, stay wetter after rain, or where foliage dries more slowly in the morning. These are strong hints of distinct microclimates.
What to verify independently: record soil type, slope, aspect, proximity to windbreaks, and any history of waterlogging or water deficit. Then define crop zones—for example a low area prone to cold-air pooling, a windy ridge, and a block with different soil texture. Practical decision: deploy sensors per critical zone, not per total hectares. Check the result: compare time series; if differences persist over several weeks, you likely have valid zonation rather than random noise. (In GrowGuard, zoning and the sensor map support exactly this kind of microclimate comparison.)
2) Frost temperature sensors: height and shielding can flip the conclusion
Mechanism: during late frosts, the temperature that matters is at the level of the sensitive organs (buds, blossoms, newly set fruit), not a reading at 2 m near a fence. On clear nights, thermal stratification can make a low spot much colder than the orchard edge. What to observe: hoar frost in depressions, uneven bud break, or “burn lines” that follow rows. A sensor mounted too high or near heat-radiating structures can miss the event.
What to verify independently: compare the sensor against a control thermometer in the same spot on calm nights, when placement errors show up most. Check that the sensor is radiation-shielded and not influenced by trunks, walls, or equipment that can store and re-radiate heat. Practical decision: move the sensor to the phenology-relevant height and into the most frost-prone zone (often a low point). Check the result: after a cold night, relate the minimum to field inspection of the organs (not bark) and to differences between zones—not to a single number from one station.
3) Air humidity, VPD, and the trap of readings that look “too perfect”
Mechanism: relative humidity and air temperature can suggest low or high vapor pressure deficit (VPD), but VPD is an estimate based on air; leaf temperature can differ, especially in sun or right after irrigation. In pears, long humid periods slow canopy drying and can predispose leaves and fruit to infection, but the sensor must sample true canopy air, not a sheltered corner. What to observe: persistent morning dew, fog sitting in one block, or abrupt changes when wind starts.
What to verify independently: confirm the sensor is properly shaded and naturally ventilated; if it sits in direct sun it can overheat and artificially reduce RH. Also check data freshness: a delay of hours can turn an irrigation decision into a late reaction. Practical decision: reposition the sensor near the canopy edge at a relevant height, protected from direct spray, and compare on a representative day with a spot measurement using a portable thermo-hygrometer/psychrometer. Check the result: see whether zone differences recur in the same time windows; if the “odd” sensor is always optimal, suspect a placement artifact.
4) Leaf wetness: a marker of favorable conditions, not a disease diagnosis
Mechanism: leaf-wetness sensors (or microclimate-based models) indicate the duration when leaf surfaces may stay wet—conditions that favor many diseases. But “wet leaf” does not confirm a pathogen’s presence and does not replace scouting; inoculum sources can come from plant debris, planting material, or irrigation water, and the sensor cannot detect that. What to observe: early spots, differences between inner and outer canopy, or infections localized to slow-drying zones.
What to verify independently: ensure the sensor isn’t being directly hit by sprinklers/anti-frost systems or by a faulty dripper that mists water; otherwise you measure applied water, not dew/rain-driven wetness. Compare with sunrise observations: are leaves uniformly wet or only in patches? Practical decision: use wetness duration to prioritize scouting and schedule preventive actions according to local technical guidance, not as a “confirmed disease alarm.” Check the result: after intervention, track whether wet-leaf duration decreases (through pruning for airflow, grass management, irrigation fixes) and whether new symptoms appear less often in the same zones at the same phenology. (In GrowGuard, risk alerts must be interpreted as risk—not detection.)
5) Soil moisture: the most common confusion is the soil volume being measured
Mechanism: in drip-irrigated pear orchards, active roots often concentrate in the wetted bulb, while the inter-row can remain much drier. If a probe sits outside the wetted volume, you may “see” stress and over-irrigate; if it’s too close to an emitter, it may read “wet” all the time and you’ll miss deficit. What to observe: vigor differences along a row, smaller fruit in specific sectors, or midday wilting limited to one stretch.
What to verify independently: do a simple field check on an irrigation day: a small pit or soil probe at the typical distance from the emitter, down through the active root depth, to confirm the wetting front reaches where you think it does. Also confirm the sensor’s reporting units and interpretation (for example volumetric water content versus matric potential), and don’t treat “percent” as a direct measure of “stress” without context. Practical decision: install probes in pairs—one in the active zone (irrigation control) and one slightly deeper (loss/leaching control)—in each distinct soil zone. Check the result: after changing duration/frequency, look for reduced stress swings during hot hours and more stable growth, not just “higher numbers” on a chart.
6) Irrigation faults vs misleading readings: finding the sector that isn’t watering
Mechanism: a low-flow sector, clogged filter, or blocked drippers can create real deficit, but sometimes data looks “dry” because the probe is poorly installed (poor soil contact, air gaps, a pulled cable). What to observe: a row with thinner canopy, uneven fruit size, or maturity differences—yet sometimes the crop looks fine while the sensor shows severe deficit. Diagnosis must start by checking the irrigation system and the probe installation.
What to verify independently: (1) check pressure and visible uniformity: emitters that barely flow compared to others; (2) check the sensor’s response to an obvious irrigation event—if nothing changes after watering, either water isn’t reaching the probe or the probe isn’t measuring correctly. Practical decision: before increasing irrigation, test the sector—clean filters, flush lines, check for kinks or pinched tubing. If it looks like a sensor issue, reinstall into re-compacted soil with good contact. Check the result: after the fix, confirm you get a coherent “signature” at each irrigation and that the gap versus a reference zone narrows over the following days.
7) EC and pH: don’t mix up irrigation water, fertigation solution, and soil
Mechanism: EC (electrical conductivity) indicates total dissolved salts, but it does not identify which nutrients are missing or their ratios; pH influences nutrient availability, but the value depends on the medium measured. In orchards, EC/pH measured in irrigation water is not the same as EC/pH in the fertigation solution, and neither equals what roots experience in the soil solution. What to observe: marginal burn, slowed growth, or chlorosis; these can resemble each other and can also resemble water stress.
What to verify independently: be explicit about method and medium: are you measuring water at the source, fertigation solution in-line, or a soil extract? Values are not directly comparable without context. On-site monitoring helps, but it does not replace laboratory water analysis when alkalinity or salinity is suspected. Practical decision: if a dedicated EC/pH probe (not a temperature sensor) indicates a change in fertigation solution, immediately confirm with a calibrated handheld meter and note whether the shift appears across all sectors or only one (possible dosing fault, bypass, suction issue). Check the result: after corrections, watch for trend stabilization and confirm with a repeat sample; in parallel, expect improvement in new growth rather than leaves already damaged.
8) Delayed data, weak batteries, and “drift”: when the problem is measurement, not the orchard
Mechanism: in orchards, signal quality can vary with terrain and dense canopy, and a sensor near end-of-life battery may transmit intermittently. That can create gaps that look like “sudden drops” or repeated values that seem stable but are actually stuck. Drift—slow changes in sensor response over time—can mimic a shift in microclimate or soil moisture. What to observe: time series with suspiciously perfect plateaus, jumps with no weather explanation, or differences that appear right after mechanical work.
What to verify independently: compare with a nearby sensor or a portable instrument; if only one point diverges, suspect the sensor or placement. Also review the work log: mowing, herbicide passes, moving hoses—these can alter local microclimate and probe-soil contact. Practical decision: run periodic audits: battery/status checks, cleaning and shielding, recalibration where applicable, and plausibility checks after key events (rain, irrigation, heat wave). Check the result: after working on the sensor, wait for a clear event (an irrigation or rain) and confirm the timing and direction of response are logical and similar to other points in the same zone. (In GrowGuard, status alerts can flag these issues early, but field confirmation still matters.)
Conclusion
In pear orchards, sensors are most useful when treated as tools for comparing zones and testing hypotheses, not as an absolute truth from a single point. Correct diagnosis starts with the mechanism (soil, air, phenology), continues with field observation, and always includes an independent check: a control thermometer, probing the wetting front, verifying dripper uniformity, and keeping water/fertigation/soil measurements distinct.
When you make a change—irrigation, maintenance, or sensor repositioning—define in advance what signal you expect to see in the data and what sign you expect to see in the crop. If they don’t align, the issue is likely placement, measurement method, or interpretation. If you want to track these block-to-block comparisons and microclimates, you can use GrowGuard for zone monitoring and alerts, then confirm in the orchard before any major intervention.