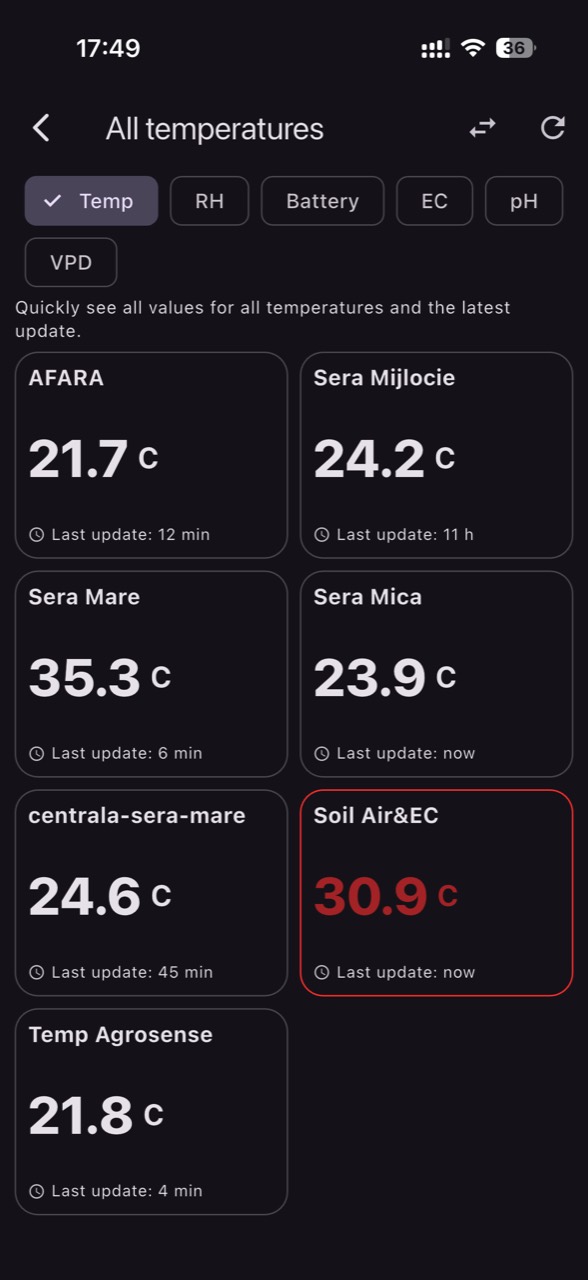
Greenhouse peppers operate within a relatively narrow functional window: flower set, fruit growth, and quality respond quickly to the combination of temperature, VPD, and root-zone water availability. Monitoring only helps if it separates real signals (plant stress) from noise (wrong readings, poorly placed sensors, or uneven zones). Otherwise, you can end up “fixing” the wrong thing.
The most common confusion starts when one sensor is expected to represent the whole structure. End bays, areas near doors, drafty aisles, rows by sidewalls, or spots under shading screens can behave differently than the center. On top of that, canopy-level air does not behave like the air above it, and the root zone has inertia that delays changes.
This article is a diagnostic guide: how to choose and place sensors by zone, how to verify values independently, and how to compare plausible causes. For each issue, we cover the mechanism, what you can observe in the crop, what to verify in the irrigation/fertigation system and in soil/substrate, one practical decision, and how to confirm afterward whether the intervention worked.
1) Zone mapping: why the “center” is not the true average
Mechanism: greenhouses develop microclimates from air leakage, uneven shading, localized heating, crop height, and leaf density. Pepper plants transpire and cool their leaves, but when VPD rises the stomata may close; leaf temperature then increases and the plant can enter heat stress even when “air temperature” looks acceptable. The result is local and uneven: flower abortion, smaller fruit, and patchy growth that follows microclimate patterns.
What to observe and verify: mark risk areas on a simple plan (ends, doors/vents, sidewalls, near main irrigation headers). Verify differences independently with a portable thermometer/hygrometer taken to the same points at the same time of day. Decision: define 3–5 zones and compare them consistently, not only absolute values. Result check: after 1–2 weeks you should see correlations between zones and symptoms, rather than “random problems.”
2) Temperature/humidity sensor placement: at the canopy, not in the airflow
Mechanism: VPD is estimated from air temperature and relative humidity, but in peppers the leaf can be warmer or cooler than the air depending on radiation, transpiration, and shade. A sensor placed too high, close to plastic, near a fan, or in direct sun can report a VPD that does not describe crop stress at canopy level. Thermal/shade screens can also split the greenhouse into air volumes that behave differently.
What to observe and verify: if the sensor shows abrupt temperature spikes exactly when ventilation starts, suspect that it sits in a jet or turbulent corridor. Verify: use a radiation shield, keep distance from heat sources, and set height close to the crop top (adjust as the canopy grows). Decision: move the sensor 1–2 m laterally away from strong currents and repeat comparisons with a handheld instrument. Result check: curves become more “biological” (smoother), while zone-to-zone differences remain consistent.
3) Data freshness and communication errors: real event or “old data”
Mechanism: a VPD peak or a soil-moisture drop only matters if it is current. In practice, low battery, intermittent signal, or a sensor “stuck” at one value can create readings that look dramatic but do not change when the greenhouse reality changes. With peppers, fast decisions (venting, shading, irrigating) can be wrong if you react to delayed or frozen values rather than the present crop environment.
What to observe and verify: look for rhythm—do values show a logical day/night pattern? Are there rare “steps” at irregular times? Verify independently: compare with another point or with a simple manual log (for example, a basic thermometer read at set times). Decision: before blaming the crop, confirm the data are recent and that the sensor responds to change (open a door briefly; start ventilation). In GrowGuard, sensor status and battery alerts can help separate device trouble from agronomic change. Result check: fewer interventions that produce no measurable effect.
4) Soil/substrate moisture: the difference between “dry” and “not irrigated where roots are”
Mechanism: moisture sensors only measure where they are installed; in peppers, active roots are often concentrated in a specific volume, and drip irrigation creates localized wet bulbs. If the probe is too far from the dripper, too shallow, or too deep, it can report “dry” while the plant still has access to water—or report “wet” while the active root zone is actually drying. Across soil types, the same reading can mean different availability.
What to observe and verify: a classic sign of misinterpretation is weak correlation between moisture trends and plant response (turgor, leaf temperature, growth rhythm). Verify independently: a small inspection hole or auger sample, checking the wet bulb after an irrigation event, and locating fine roots. Decision: install at least two points per zone—one in the active root zone, one deeper to track loading/drainage. Result check: irrigations create a clear signature in the data (a rise after events, then a gradual decline between events).
5) Detecting irrigation faults: clogged drippers versus heat stress
Mechanism: during hot periods peppers may look “scorched” from high VPD, but similar symptoms can come from uneven distribution: a dry sector, low pressure, a plugged filter, or partially clogged drippers. Moisture readings become misleading if you have only one sensor in a spot that still receives water while other rows slip into deficit. The crop then shows patterns that can be mistaken for “general climate stress.”
What to observe and verify: look for structure—do affected plants follow a dripline, a row, or an end section? Verify independently: check flow at line ends, pressure, differences between the start and end of a row, and wetting uniformity shortly after starting irrigation. Decision: align your zone map with irrigation hardware (sectors, valves). Result check: after repair, sensors in the “problem” area should respond to each irrigation event; new symptoms should slow down, while old damage will not disappear instantly.
6) EC and pH in fertigation: don’t mix media and methods
Mechanism: EC and pH can be measured in source water, fertigation solution, drainage, or a soil/substrate extract; these are different measurements and cannot be compared directly as “the same value.” EC indicates total soluble salts, not which nutrient is missing. If root-zone EC increases, water uptake can be reduced and heat stress can worsen even when moisture looks adequate. Temperature sensors do not measure EC or pH; dedicated probes are required.
What to observe and verify: if leaves seem rigid, margins scorch, or growth stalls while moisture appears correct, consider salt accumulation. Verify independently: measure pH/EC with dedicated probes in the fertigation solution and, separately, in a representative drainage sample or extract—keep methods consistent. Also consider water quality: pH, alkalinity, and soluble salts are different parameters; on-farm pH/EC monitoring complements, not replaces, laboratory analysis. Decision: define which medium is your farm reference and compare “like with like.” Result check: after adjustments, watch whether root-zone EC stabilizes and whether the plant returns to a normal water-use rhythm.
7) True heat stress in peppers: when air “looks fine” but the plant suffers
Mechanism: under high VPD, transpiration can become excessive or stomata may close to conserve water; in both cases leaf temperature can rise and photosynthesis drops. In peppers, the consequences can show up as weak set, flower drop, slow fruit sizing, or deformities. An air sensor does not directly measure leaf temperature, and VPD remains an estimate from air temperature and RH—useful, but not the whole story.
What to observe and verify: watch plants during critical hours (hypothetically, mid-to-late afternoon): slight leaf curling, increased flower drop, and differences between sunny and shaded zones. Verify independently: use an IR thermometer on leaves (at least comparatively across zones), confirm shading and ventilation performance, and check root-zone moisture to rule out irrigation deficit. Decision: if stress is primarily thermal, prioritize energy management (shading/ventilation/avoiding overheating) before trying to “solve it” only with more water. Result check: compare next-day VPD curves by zone and observe whether plants maintain turgor and whether flower abortion gradually reduces.
8) Comparing microclimates: a triangulation protocol so one sensor can’t fool you
Mechanism: strong diagnosis comes from agreement between (1) canopy air (T/RH and VPD), (2) root zone (moisture, and sometimes temperature), and (3) fertigation (pH/EC in the chosen medium). If only one dataset “shouts,” it may be an artifact. Pepper responses also lag: some symptoms appear after days, so data need context (history, weather events, greenhouse work). Disease-risk alerts, where used, indicate risk patterns—not pathogen detection.
What to observe and verify: use zone comparisons—end versus center, sidewall versus interior, dense row versus sparse row. Hypothetical example: if only the end near a door shows repeated moisture drops and plants are smaller, the cause may be infiltration and higher evaporation rather than a “whole-greenhouse irrigation problem.” Verify: repeat manual measurements in that zone, inspect the local irrigation line, and record a small intervention (seal a leak, adjust venting). Decision: keep one reference sensor in a stable zone and one in a risk zone. With GrowGuard, zone maps and history help you see whether the difference persists. Result check: a good intervention reduces the gap between zones; if the gap is identical, revisit sensor placement or sensor function.
Conclusion
Monitoring greenhouse peppers becomes truly useful when you treat it as a diagnostic instrument, not a “truth thermometer.” Define zones, place sensors at representative points, confirm data freshness, and systematically compare canopy air with the root zone and fertigation—always within the same measurement medium and method. Avoid fast conclusions based on a single chart.
When you see an alert or a symptom, ask: is it a local microclimate, an irrigation hardware issue, salt accumulation, or true heat stress? Then do an independent check, make a small targeted change, and measure the effect over the next 24–72 hours. If you want an easier way to work by zones and track differences between microclimates, GrowGuard can centralize sensor data and alerts—but the validation protocol remains the key.