In fertigation, pH and EC are not “two numbers on a screen.” They are signals about what happens to nutrients between the tank, the irrigation line, and the root zone. When pH drifts or EC climbs too far, plants can show deficiency-like symptoms even when fertilizer is present. That is why control begins with measurement that is correct and comparable.
Nutrient lockout often comes from combinations: an unsuitable pH in the solution, high water alkalinity, salt accumulation in substrate/soil, or short irrigations that do not rinse the root zone enough. Salinity stress, in turn, reduces water uptake and can effectively “shut down” a plant, especially when transpiration demand is high. The key indicator is not only EC at the inlet, but the difference between inlet and drainage/extraction.
This article explains the technical fundamentals and a commissioning workflow: which medium you are measuring (water, fertigation solution, drainage, substrate extract, soil), which units and data freshness matter, which sensors are appropriate, and which independent checks you must run. Examples are explicitly hypothetical and aim to show how you make a decision and verify results within 24–72 hours—without imposing universal recipes.
1) Define what you are measuring: pH, alkalinity, and soluble salts are not the same
Mechanism: pH reflects hydrogen ion activity, but how stable pH remains depends heavily on alkalinity (the water’s buffering capacity against change). EC reflects conductivity—the total soluble salts—without telling you which nutrients are present. Two waters can share the same pH yet have very different alkalinity, and acid injection can produce completely different outcomes. In practice, on-site pH/EC monitoring complements laboratory water analysis; it does not replace it.
What to observe: if tank pH looks “correct” but pH at the end of the line or in drainage deviates, you likely have a mixing issue or reactions occurring in the system or growing medium. What to verify independently: periodic water analysis for pH, alkalinity, and soluble salts, plus a consistent root-zone method (drainage for substrate, extraction for substrate/soil). Decision: choose control points and define what “inlet” and “outlet” mean. Check the result: look for a stable inlet–outlet difference, not a single isolated value.
2) Choose measurement points: tank, line, drainage, and the root zone
Mechanism: in fertigation, solution chemistry can change along the path due to deposits, contact time, dosing variation, and aeration. In substrate/soil, salts accumulate when input exceeds leaching, and pH can shift through biological processes and cation exchange. That is why EC/pH “at the pump” can look fine while roots are under osmotic stress or sitting at a pH that locks certain elements (for example, micronutrients or phosphorus, depending on the direction of the shift).
What to observe: persistent differences between inlet EC and drainage/extraction EC, plus plant responses (midday wilting, tip burn, rigid growth, chlorosis). What to verify independently: take manual samples at the same times of day, from the same sectors, using clean containers, while noting solution temperature (EC is temperature-influenced and many meters automatically compensate). Decision: set a minimum routine—measure at both inlet and outlet, not only one point. Check the result: after adjustments, confirm the “gap” narrows and that uptake behavior becomes consistent (for example, drainage returns to a repeatable pattern).
3) Sensors and instruments: which probes fit, and what failures are common
Mechanism: pH requires a dedicated electrode, and EC requires a conductivity cell; a temperature sensor cannot measure pH/EC. In fertigation you need probes compatible with the medium (water/solution), temperature compensation for EC, and realistic maintenance for pH (electrodes foul, dry out, and age). In systems using concentrated fertilizers, scaling and biofilm can introduce reading drift—especially if the probe sits in a low-flow or stagnant pocket.
What to observe: “frozen” values that do not change even when you make changes, abrupt jumps without an operational reason, or a slow week-to-week drift. What to verify independently: spot-check with a calibrated handheld instrument and appropriate standards (pH buffers; a conductivity standard), and visually inspect the measuring chamber. Decision: select probes you can clean and calibrate, and define a verification interval (more frequent at the start, then periodic). Check the result: keep a calibration log and compare fixed-probe versus handheld deviations; if the difference grows, treat it as maintenance/installation trouble—not a real crop change.
4) A commissioning protocol: from “installed” to “usable data” in 7 steps
Mechanism: commissioning reduces the risk of agronomic decisions based on wrong data. A practical workflow: (1) confirm units (EC in mS/cm or µS/cm) and temperature compensation; (2) verify flow direction and avoid air bubbles around the EC cell; (3) calibrate pH and EC per instructions; (4) run a side-by-side comparison with a handheld meter; (5) mark the exact sampling point; (6) set sampling frequency and a data freshness criterion; (7) define alert logic on deviations, not absolute numbers.
What to observe: in the first days, the most valuable signals are consistency and response to events (starting fertigation, changing the recipe, cleaning filters). What to verify independently: a “control” sample of plain water and a sample of working solution, measured under the same conditions. Decision: if you see large point-to-point differences (for example, tank vs. end of line), fix mixing, circulation time, or probe location before changing the nutrition recipe. Check the result: commissioning is successful when values change logically after intentional changes and the instrument-to-instrument differences remain stable over time.
5) Interpreting EC: recognizing salt build-up and salinity stress
Mechanism: high EC in the root zone increases osmotic pressure; the plant must spend more energy to take up water and may reduce transpiration, especially on warm, high-demand days. In substrates, short and frequent irrigations without enough drainage concentrate salts. In soil, surface evaporation and uneven wetting can create saline “pockets.” Important: EC of fertigation solution, EC of drainage, and EC from a substrate/soil extract are different measurements and should not be compared as if they are identical.
What to observe: relatively stable inlet EC but drainage/extraction EC that rises progressively, plus symptoms such as marginal necrosis, slowed growth, midday wilt, and reduced fruit quality or uniformity. What to verify independently: compare sectors (zones) and relate patterns to irrigation (flow, runtime), not only to fertilizer input. Decision: adjust irrigation strategy first (for example, add a controlled leaching/rinse phase or restructure pulses so fresh water reaches a larger root volume) before blindly cutting nutrients. Check the result: within 24–72 hours, confirm that drainage/extraction EC stops climbing and the plant’s daytime recovery improves.
6) Interpreting pH: why a “good tank pH” does not guarantee uptake
Mechanism: pH affects chemical forms and availability of nutrients and also influences microbiological activity in the rhizosphere. With high-alkalinity water, pH tends to rebound upward when acidification is insufficient, and the root-zone pH can also rise due to preferential uptake of anions/cations. Some fertilizers and additives can shift pH over time, especially if solution sits in a tank without mixing. Lockout happens when rhizosphere pH shifts enough that certain nutrients become harder to access even when present.
What to observe: “deficiency-like” symptoms that do not respond to higher dosing (for example, chlorosis, weak shoot tips), together with drainage/extraction pH that differs from inlet pH. What to verify independently: confirm pH with a calibrated handheld meter and, if it persists, send samples for analysis (water and, when relevant, substrate/soil extract) to separate pH effects from alkalinity effects. Decision: adjust pH control based on real water behavior and root-zone response, not only on the injector setting. Check the result: confirm outlet pH stabilizes and that new symptoms slow down (do not expect old leaves to fully “repair”).
7) Operational traps: mixing, response time, data freshness, and rare events
Mechanism: many pH/EC “mysteries” are process issues: insufficient tank mixing, wrong dissolution order, pressure fluctuations, pulsed injection, loaded filters, or top-up water with different quality. Then there is response time—what you measure now may reflect solution from 10–30 minutes earlier depending on volume and distance. If data arrives late or has gaps, you can misread a spike as a trend. A robust approach separates real changes from measurement artifacts.
What to observe: EC/pH that “jumps” when pump speed changes, or large differences between the start and end of a fertigation event. What to verify independently: check pressure and flow manually, inspect filters and potential air ingress points; then correlate with an operations log (when you changed recipe, when the tank was topped up). Decision: set rules—do not conclude from a single point; use sequences and inlet–outlet comparisons. Check the result: after corrections, expect smoother curves and repeatability across similar days (under comparable weather and irrigation conditions).
8) A practical zone-based monitoring and validation workflow (hypothetical example)
Mechanism: decisions become safer when you compare similar zones and track gaps rather than chasing a “perfect” single number. Hypothetical case in a substrate-grown greenhouse crop: Zone A shows rising drainage EC and more midday wilt, while Zone B is stable. Working hypotheses: A receives less effective water (partly clogged drippers) or has insufficient drainage. You measure inlet and drainage pH/EC for both zones and then verify irrigation uniformity.
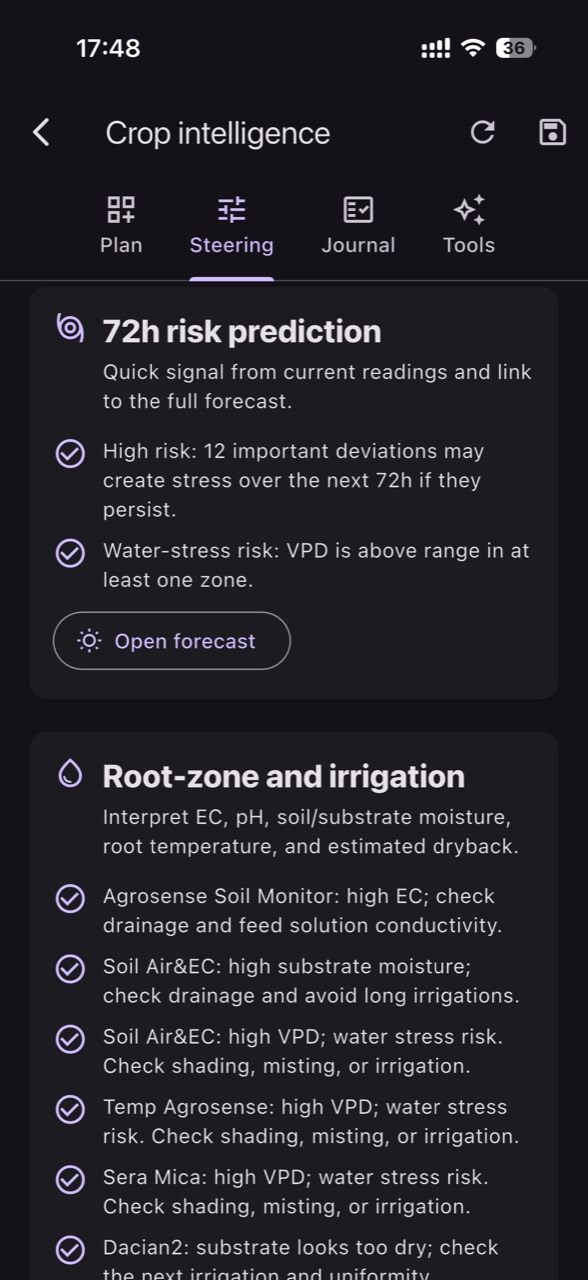
What to verify and decide: mechanically inspect the line in Zone A and compare flow, then adjust irrigation pulses to achieve more uniform rinsing without exaggerating volumes. If you use a monitoring platform such as GrowGuard, you can view zone differences and set alerts when the inlet–outlet deviation widens, but the decision remains agronomic and operational. Check the result: over the next 1–3 days, Zone A’s drainage EC trend should move closer to Zone B and midday wilt should ease; if not, revisit assumptions (water quality, recipe, other non-uniformities).
Conclusion
Controlling pH and EC in fertigation starts with a simple idea: you must know what you are measuring, in which medium, and by which method—otherwise you are comparing different things. A commissioning protocol (calibration, handheld cross-checks, fixed sampling points, data freshness criteria) protects the crop from rushed decisions and helps you distinguish chemical causes from hydraulic or distribution problems across zones.
When pH and EC are monitored consistently at the inlet and in the root zone, you can separate nutrient lockout from salinity stress and quickly validate whether an adjustment actually works. If you want to track these zone-to-zone differences and receive alerts when deviations become risky, GrowGuard can support team monitoring alongside the independent checks described above.