In potato production, the difference between a good decision and a costly one can start from a single reading: soil that looks “wet” only because the surface was watered, or “dry” because the sensor is not sitting in the active root volume. That’s why diagnosis begins with placement and validation of sensors, not with thresholds imposed from a desk.
Potatoes have a relatively shallow root system and are sensitive to low oxygen in the root zone. At the same time, a dense canopy easily creates a humid microclimate between rows, and poorly tuned irrigation can support long periods of leaf wetness. Phytosanitary risk alerts must be read as “favorable conditions,” not proof of a pathogen or a confirmed diagnosis.
This guide is built as a differentiation protocol: a real crop issue versus a misleading reading or an equipment problem. You’ll see how to divide a field into zones, how to compare microclimates, and what independent checks to do before changing irrigation or triggering a treatment. The examples are hypothetical, to show the logic of the decision.
1) Know what you are measuring: soil volume, time, and units
Soil-moisture sensors do not “see” an entire field; they represent a small volume around the probe. In potatoes this matters because the ridge, the hill, and the inter-row can behave very differently: the hill often dries faster and warms differently than the soil between rows. A correct reading must be interpreted against depth and position in the soil profile, not against what the surface looks like.
A typical error mechanism is confusing surface wetting with refilling the active root volume. What to observe: after irrigation, the shallow sensor jumps quickly while the deeper one stays unchanged. What to verify independently: a small inspection hole or a manual probe to confirm how deep moisture actually reached. Practical decision: adjust irrigation duration or pulsing, then check the result in the trend history—an increase should appear at the target depth, not only near the surface.
2) Potato placement: hill position, distance from drip line, and two useful depths
In potatoes, the most common mistake is installing the sensor too close to the emitter (in the wettest zone) or too far away (in a zone that rarely wets). For diagnosis, you want a point representative of roots and a control point for percolation. In practice this usually means two depths in the same profile: one to track crop uptake and one to show whether water is moving below the active zone.
What you observe when placement is wrong: very large swings at every irrigation start (too close to the emitter), or “noisy” curves unrelated to irrigation (poor soil contact). What to verify independently: remove and reinsert carefully, avoid creating an artificial air gap, and ensure consistent contact along the probe length; confirm with a manual check shortly after irrigation. Practical decision: relocate the probe to a more representative distance and compare the two-depth curves again over the next 2–3 irrigation events.
3) Crop zones: why a single station can mislead in large potato blocks
Potatoes are sensitive to small differences: texture (sandy versus loamy), depth to a restrictive layer, compaction along machinery tracks, and exposure differences from wind or shading. If you treat a large field as “one point,” alerts become either too frequent or easy to ignore. Zoning is not a digital luxury; it is a practical way to preserve signal and reduce misleading readings.
Mechanism: the same irrigation amount produces different responses in different zones. What to observe: one sensor shows a rapid drop (lighter soil), another declines slowly (heavier soil), and you receive contradictory signals. What to verify: compare zones with simple field observations (ponding, cracking, emergence uniformity, vigor differences). Practical decision: set alert thresholds by zone rather than globally; check the result by looking for more consistent consumption patterns and fewer visible stress differences after irrigations.
4) Comparing microclimates: the air above the canopy is not the same everywhere
Disease pressure in potatoes rises when the canopy stays wet and leaf-drying intervals are short. The microclimate between rows can differ from the field edge, areas near shelter belts, depressions, or canals. Temperature and humidity sensors capture “favorable conditions,” but they do not confirm the presence of a pathogen and cannot replace field inspection.
What to observe: two points with similar temperatures but different relative humidity, especially in the evening and at night; VPD calculated from air temperature and relative humidity is only an estimate, and the leaf can be cooler and wetter than the air. What to verify: the presence of dew across zones, how long leaves remain wet, and the earliest suspicious lesions on lower leaves. Practical decision: shift irrigation timing (for example, earlier) or reduce conditions that prolong wetness; check the effect by confirming shorter nighttime periods of very high humidity in the problematic zone.
5) Phytosanitary risk alerts: separating favorable conditions from “panic”
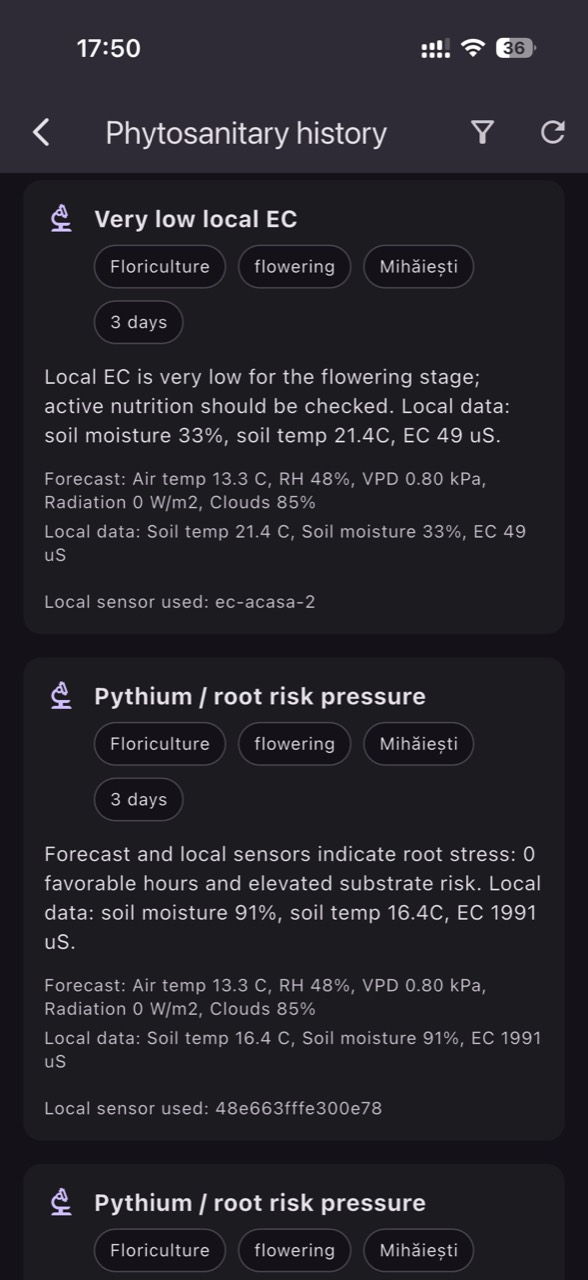
A phytosanitary risk alert is an invitation to scout, not a diagnosis. Pathogens may be introduced or maintained by plant debris, planting material, or irrigation water, while microclimate data only indicates whether the environment is conducive to infection and sporulation. In potatoes, misreading risk leads either to unnecessary treatments or to delayed action when early foci are actually present.
What you observe with misleading alerts: high risk on the dashboard but no symptoms and no plausible history of sources; or moderate risk while spots appear in zones where leaves remain wet after irrigation. What to verify: systematic scouting along transects, denser in cooler/wetter microclimates; also check potential sources (debris, volunteers, irrigation water). Practical decision: trigger scouting and, if warranted, plan intervention; check results by tracking symptom development and correlating it with humid periods, not with a single alert instance.
6) Persistently high soil moisture: real irrigation issue or a “drowned”/misinstalled probe?
In potatoes, excess water reduces aeration, slows root development, and can favor tuber rots, especially if the soil remains saturated for long periods. Yet a consistently “very wet” reading can also be an artifact: a probe installed in a localized poor-drainage pocket, in a fine-soil smear created during installation, or too close to an end-of-line leak. Diagnosis requires comparison and field verification.
What to observe: high moisture that does not drop even in warm days while the crop looks relatively normal; or it drops, but much more slowly than in other zones. What to verify: actual infiltration with a small hole, anaerobic smell, signs of ponding, and uniform flow in the irrigation sector; if you have two depths, check whether the deeper layer stays “full,” suggesting percolation or a restrictive layer. Practical decision: reduce runtime/starts, split into pulses, or fix the sector; check by seeing a gradual decline between irrigations and improved canopy appearance over the next 2–4 days.
7) Surprisingly low moisture: sensor outside the root zone or a true deficit
Water deficit in potatoes can reduce tuber set and bulking, and oscillating stress (rare, heavy irrigations) can intensify non-uniformity. But a “dry” reading can also occur if the sensor sits too high in the hill where it dries rapidly, or where roots have not reached (compaction, deeper seed placement, crusting). If you respond only to the number, you may over-irrigate a field that actually has sufficient water deeper down.
What to observe: a sharp midday drop without visible wilting; or two zones irrigated identically while one seems “always dry.” What to verify: real rooting depth (checked carefully without excessive disturbance), moisture 10–15 cm below the sensor, and the probe’s position relative to the drip line. Practical decision: if deficit is real, increase frequency with smaller volumes; if it’s placement, move the sensor into the active volume. Check by improved alignment between irrigation events and sensor response, plus the disappearance of subtle stress signs.
8) EC and irrigation water: when “salts” seem to spike overnight
In potatoes, salinity in the root zone can amplify water stress and reduce water uptake, but EC must be interpreted correctly because the medium and method matter. EC in source water, in fertigation solution, in a substrate extract, or in soil solution are different measurements and should not be compared directly. Also, EC does not identify individual nutrient concentrations; it only indicates total dissolved salts.
What to observe: after a hypothetical fertigation event, EC “explodes” at one sensor while the plant shows no stress; or EC rises as moisture falls, consistent with concentration through evaporation and uptake. What to verify: take water samples for laboratory analysis (pH, alkalinity, salts) and use on-site EC/pH monitoring as complementary tracking; confirm whether the probe measures soil solution EC or another extraction method, and check for deposits on sensing elements. Practical decision: adjust leaching/irrigation strategy or solution composition with agronomic guidance; check by a gradual EC decline after flushing irrigations and by reduced zone-to-zone divergence.
Conclusion
A well-commissioned sensor system in potatoes does not mean more graphs; it means fewer confusions. When probes are placed correctly, fields are split into real zones, and microclimates are compared, alerts become diagnostic tools: they tell you where to look, what to verify independently, and how to measure the effect of a decision—rather than pushing you to react to an isolated number.
If you use GrowGuard, keep the validation discipline: phytosanitary risk alerts do not detect pathogens, and VPD computed from air data remains an estimate. Configure zones, review history after each adjustment, and record field observations alongside readings. For a placement and commissioning plan tailored to your farm, consider a short technical discussion with your team or an integrator.