In potatoes, water simultaneously drives canopy growth and tuber formation. A prolonged deficit can reduce tuber number and sizing, while excess can promote root-zone oxygen stress and a “cold” soil with cascading effects. That is why monitoring should track the active root zone—not just rainfall totals or an irrigation calendar.
Many issues blamed on “drought” or “disease” are actually combinations: uneven soil, uneven water application, crusting, compaction, or a microclimate window that favors leaf infection. Sensors help only when they are installed correctly in the field, read in the correct units, and validated with simple, repeatable checks.
This article explains technical fundamentals and a commissioning workflow for potatoes: how to select soil and microclimate sensors, how to build local alert thresholds, how to turn data into irrigation decisions, and how to verify whether an intervention truly changed conditions. Examples are hypothetical and must be adapted to cultivar, soil, and irrigation system.
1) Why potatoes are sensitive to the soil-water “rhythm”
Potatoes have a critical period when tubers initiate and bulk up: large swings from “very dry” to “very wet” can lead to uneven growth and variable quality. The mechanism is straightforward: the plant alternates between water stress and rapid recovery, and the tuber responds with discontinuous growth. What you may observe: leaves wilting at midday, recovering in the evening, followed by rapid growth after irrigation.
What to verify independently: quick digs near the hill (a simple soil profile), clod consistency at different depths, and how moisture is distributed under drip tape or sprinklers. Practical decision: avoid “catching up” with a large irrigation after a dry spell; instead correct frequency or sectoring to reduce oscillations. How to check the result: over the next 24–48 hours, moisture curves should show moderate recharges and predictable daily drawdown without sharp peaks or crashes.
2) Choosing sensors: what each one measures and in what medium
For potato irrigation, the key sensor is soil moisture, ideally paired with soil temperature. Depending on technology, you may read volumetric water content (VWC), tension (kPa), or a proprietary index; the important point is consistency in units and building a local interpretation. For salinity and acidity/alkalinity, you need dedicated probes: EC and pH are not derived from temperature or moisture readings.
With EC, always state the method and medium: EC of fertigation solution (water plus fertilizers), EC from a soil/substrate extract, and bulk-soil EC are different measurements and are not directly comparable. What to observe: EC rising after fertigation or strong evaporation; falling after rain or a leaching irrigation. What to verify: periodic laboratory water analysis, plus on-site pH/EC checks as ongoing monitoring—not as a replacement. Decision: adjust irrigation and leaching strategy, not a specific nutrient, based on EC alone.
3) Depth placement: where the “active zone” is in potatoes
Commissioning starts with a clear assumption: the effective rooting depth and the zone where you want to control water. In potatoes, tubers form in the upper layer, and excess water there is especially risky for soil aeration. That is why a single depth can be insufficient. What you may observe: irrigations that look “right” at the surface but leave deeper layers too dry—or, conversely, keep them permanently close to saturation.
What to verify independently: two short digs in representative areas, one in a “good” sector and one in a “weak” sector, to see how deep water reaches and where it sits. Practical decision: install at least two measurement depths (for example near the tuber zone and slightly below it) to distinguish recharge from percolation. How to check the result: after a typical irrigation, the upper sensor should rise quickly and the lower sensor should rise later or moderately; if both jump sharply, you likely irrigate too much or infiltration is too fast.
4) Data commissioning: freshness, units, drift, and typical errors
Before making decisions, check “data hygiene.” Freshness (how recent the last reading is) matters: a good value that is old can trigger unnecessary irrigation. Next, confirm displayed units and consistency: VWC in percent is not interpreted like tension in kPa. A common installation failure is placing a sensor in an air pocket or in overly loose backfill, producing “dry” readings even right after irrigation.
What to verify independently: compare the moisture curve to real events (rain, irrigation start/stop), then do an on-site check immediately after irrigation (soil wet to the touch, without standing water). Decision: if the signal does not react to irrigation, do not “correct” with more water; reassess placement, soil contact, or whether the spot represents the irrigation pattern. How to check the result: after remediation, you should see reproducible responses to the same irrigation durations and a coherent daily decrease aligned with weather demand and crop stage.
5) A data-based irrigation workflow: turning curves into actions
A practical approach is to use the daily curve: recharge after irrigation, then gradual consumption. Mechanism: the plant uses water and the soil loses moisture; when decline becomes too steep or reaches a stress zone, the risk increases for growth interruptions and tuber variability. What to observe: how quickly moisture drops between irrigations and whether there are “plateaus” (possible saturation) or “step drops” (possible supply interruptions).
What to verify independently: irrigation uniformity (pressure, clogging, sector performance) via inspection of emitters/sprinklers and filtration, plus a visual check of vigor along rows. Decision: adjust duration, frequency, or sector splitting; in potatoes, frequency often matters more than infrequent, heavy irrigations. How to check the result: on similar-weather days, curves from different zones should converge; if one zone consistently lags, you have a distribution problem rather than a global “setting” issue.
6) EC and pH: using them without drawing the wrong conclusions
In potato production, EC and pH are most useful as process signals: what you deliver in irrigation/fertigation and what remains in the root zone. Mechanism: evaporation and plant water uptake can concentrate salts, and wet–dry cycling can amplify the effect. What to observe: EC rising during hot periods or when irrigation is reduced; pH shifting after changes in water source or fertilization program.
What to verify independently: distinguish measurement in irrigation solution (in-line or at row end) from measurement in soil; if you want a soil picture, use a consistent sampling method and periodically confirm with laboratory analysis for water and soil. Practical decision: if soil EC rises, your first action is to verify infiltrated volume and accumulation risk (for example heavier soil, slow drainage), not to “diagnose” a specific nutrient. How to check the result: after irrigation adjustments or a controlled leaching event, the EC trend should decline gradually without signs of renewed water stress.
7) Phytosanitary risk alerts: conducive microclimate, not a diagnosis
In potatoes, phytosanitary risk is strongly influenced by microclimate: periods of high humidity, wet leaves, and favorable temperatures can create infection windows for foliar diseases. The general mechanism is “conducive conditions,” not guaranteed pathogen presence. Air temperature and humidity sensors help identify these windows; VPD computed from air temperature and RH is an estimate, and leaf temperature can differ from air temperature.
What to observe: long humid nights, mornings with slow drying, or persistent moisture within the canopy. What to verify independently: targeted scouting on the same day and in the same zones, looking for early symptoms and checking possible sources (plant debris, planting material, irrigation water). Decision: act operationally (for example irrigation management to avoid leaf wetness, or treatment timing according to local guidance), not simply because an alert exists. How to check the result: track whether risk windows shrink under similar conditions and whether scouting confirms no symptom progression.
8) Putting alerts into operation by zone: local thresholds and fewer “false alarms”
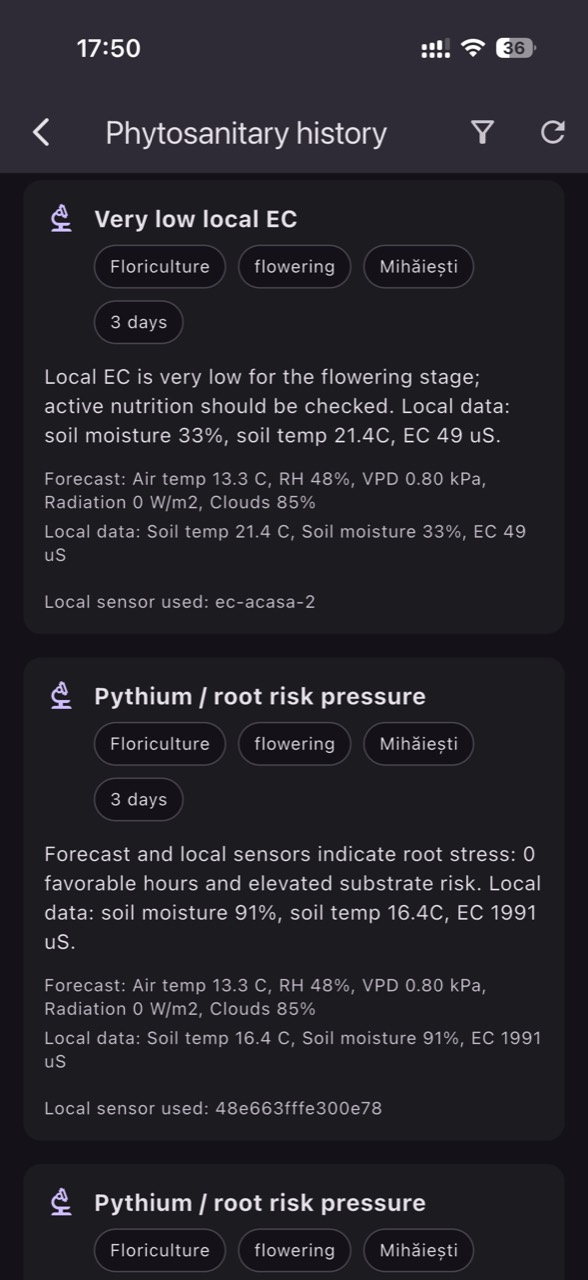
Useful alerting starts with zoning: within one field you can have texture shifts, small slopes, headlands, or irrigation sectors that completely change curves. In GrowGuard, readings can be interpreted by real crop zones, but thresholds must be built from your own history, not copied. What to observe: what values appear before wilting, before ponding, or before repeated periods of humid canopy microclimate.
What to verify independently: mark 2–3 hypothetical “events” during the season (a heat day, a heavy rain, a long irrigation) and record what you saw in the field. Decision: set alerts on trends (rapid drop, no response to irrigation, prolonged high air humidity) plus status alerts (battery, missing data) so you do not confuse a network issue with an agronomic issue. How to check the result: after 2–3 weeks, adjust thresholds so they trigger concrete actions rather than messages everyone ignores.
Conclusion
A good potato monitoring system is not the one with “the most sensors,” but the one properly commissioned: clear units, placement verified by digging, correlation with real events, and thresholds built from your own history. For every issue (water, EC/pH, phytosanitary risk), separate signal from assumption: measure, observe in the field, verify independently, and only then intervene.
If you want to shorten the time between “I suspect a problem” and “I have a decision,” a monitoring platform such as GrowGuard can keep zones, history, and alerts in one place. Invite your team to agree on what makes an alert actionable and how it will be validated with a short, repeatable check in the field.