Uniformity in potted flowers is rarely lost “all at once.” More often, small differences creep in: a bench with cooler air, an area with a persistent draft, a corner with recurrent condensation, or a walkway that overheats at midday. Plants translate these differences into different growth and flowering rhythms, and those differences become visible only after time has passed.
When you rely on a single measurement point, it is easy to misread the cause. A “too humid” value may come from a sensor mounted in a fog stream or near a cold surface—not from the greenhouse climate as experienced by the crop. Likewise, a “too hot” temperature can be solar radiation warming the sensor body, not the air within the plant canopy.
This guide is built as a diagnostic protocol: how to choose measurement points, how to define crop zones, and how to compare microclimates so you can separate a real issue (ventilation, heating, thermal screen, air flow) from a reading issue (placement, shielding, sensor drift, non-fresh data).
1) Why microclimate matters more than a greenhouse average
In potted-flower production, small temperature and humidity differences may not look dramatic in the numbers at first, but they show up in plants: uneven height, different internode length, variable leaf texture, staggered flowering, and a delivery window that becomes harder to hold. The mechanism is straightforward: transpiration and gas exchange depend on the air right around the leaf, and that air can differ greatly between edge and center, and under benches or hanging baskets.
What to observe: batches that “run ahead” on one side of the house, corners where leaves stay wetter in the morning, or an area needing repeated interventions for molds and leaf spots. What to verify independently: the air path (fans, vents, curtains/screens), the presence of structural condensation, and shading patterns. Practical decision: do not regulate based on one average—work by zones. Check the result: over the next 24–72 hours, confirm whether zone-to-zone differences shrink and whether visual symptoms slow.
2) Sensor placement: height, shielding, and “representative air”
A good sensor can still deliver a wrong value if it measures non-representative air. In flower greenhouses, the relevant point is at canopy height, not by the door, near the control cabinet, or tight against heating pipes. The error mechanism is common: solar radiation warms the housing, a cold jet from a vent depresses temperature locally, and a sensor near a cold surface can “see” higher humidity because that boundary layer approaches saturation.
What to observe: temperatures that spike abruptly only at certain hours, or humidity values that stick high whenever fog/misting starts. What to verify independently: sun exposure (is there a radiation shield?), distance to nozzles, heaters, and screens, and whether air naturally moves at that point. Practical decision: relocate the sensor by a small, controlled change (hypothetically 0.5–1 m) or adjust height, then repeat the comparison. Check the result: curves should become plausible and correlate with greenhouse events, not with one nearby piece of equipment.
3) Crop zones: choosing “pivot” points and “problem” points
A practical protocol starts with a mental map of the greenhouse: pivot zones (representing most of the crop), problem zones (suspected), and edge zones (doors, row ends, near sidewalls). Floriculture often has vertical microclimates: the leaf mass at pot level differs from the air in walkways, and with hanging baskets the upper layer can be warmer and drier. That is why one mounting height rarely captures everything important for uniformity.
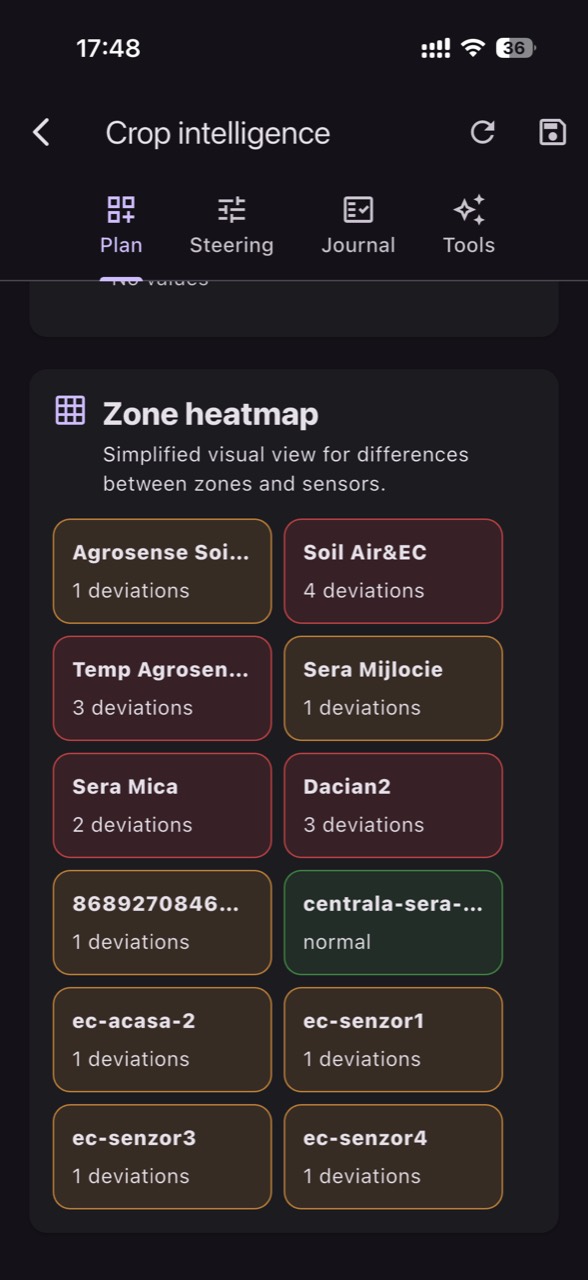
What to observe: differences between shelves, benches and baskets, or between the row end and the middle. What to verify independently: use a portable thermometer/hygrometer for spot checks at the same minute as the fixed sensor reading, to confirm whether the difference is real or installation-related. Practical decision: define distinct zones and track each separately (for example, in a platform such as GrowGuard, using true crop zones). Check the result: if the “problem” remains local, it is likely a microclimate; if it migrates, the entire greenhouse regime has shifted.
4) Comparing microclimates: what a “credible” difference looks like
Credible differences follow physics and schedules: edges respond faster to outdoors, central zones change more slowly; mornings can show humidity peaks from overnight cooling and evaporation; afternoons show temperature lift from radiation. A suspicious difference is one that appears only on one sensor without any relationship to ventilation timing or weather changes. Also watch units and time windows: comparisons must be made over the same intervals, with the same data frequency, or you can manufacture differences that are only sampling artifacts.
What to observe: a sensor with short “jumps,” or values that remain constant for too long (potentially a stuck reading or repeated non-fresh data). What to verify independently: date/time of the last transmission, battery/status, and a manual check in the zone. Practical decision: before changing ventilation or heating settings, validate that data are current and coherent. Check the result: after correction (move, shield, fix connectivity), remaining zone differences should be stable and explainable rather than random.
5) High humidity and condensation: mechanism, confusions, and confirmations
In flower greenhouses, the issue is rarely “high relative humidity” in the abstract; it is the duration of leaf wetness and how long the air inside the plant mass stays close to saturation, especially at night and early morning. Weak air movement and temperature differences between surfaces encourage condensation. This microclimate can favor foliar problems such as Botrytis, but the reading only indicates conducive conditions—it is not proof of a pathogen’s presence and it is not a confirmed diagnosis.
What to observe: a water film on leaves in the morning, condensation on plastic/glass, and flowers or buds browning in cold, damp pockets. What to verify independently: inspect plant debris accumulation, mother plants, trays, and tools; inoculum sources can persist there, and sensor readings do not “prove” a biological cause. Practical decision: improve local air movement and reduce time spent at saturated air via heating/ventilation management. Check the result: record whether leaf-wetness frequency drops and whether the zone returns toward uniform development.
6) Uneven temperatures: radiation, drafts, and thermal inertia
For potted flowers, temperature differences directly influence development rate and flowering timing. In protected spaces, cold-air “pockets” form at ends, near doors, or under screens, while warm “islands” occur near pipes, generators, or high-radiation areas. A sensor exposed to radiation can overestimate air temperature; conversely, a sensor in a cold draft can underestimate and push you toward unnecessary heating. Both errors translate into uneven crop pace and misleading troubleshooting.
What to observe: more compact plants in one zone (potentially cooler), stretch in another (potentially warmer and/or warmer nights), or flowers opening several days apart within the same batch. What to verify independently: measure temperature at pot level and at leaf level; substrate and leaf mass can have different thermal inertia than air. Practical decision: correct warm/cold air distribution and check sealing, screens, and fan patterns. Check the result: look for curve convergence between zones and reduced differences in phenological stage.
7) VPD as a diagnostic tool (with its limits)
VPD, calculated from air temperature and relative humidity, helps interpret transpiration demand: whether air is “pulling” water from the plant or suppressing transpiration. In potted flowers, very low VPD can mean reduced transpiration, persistently wet leaves, and higher risk of foliar issues; very high VPD can increase stress, edge scorch, and erratic water use. However, VPD is an estimate from air conditions: leaf temperature can differ from air temperature, particularly under strong sun or when stomata close.
What to observe: two zones with similar temperature but different humidity can have different VPD and plants that look different. What to verify independently: confirm whether leaves are cooler (active evaporation) or warmer (radiation load, stomatal closure) through observation and, if available, a spot measurement. Practical decision: use VPD to prioritize interventions (ventilation, screening, air movement), not as a universal setpoint. Check the result: after changes, confirm plant response (turgor, appearance) aligns with the VPD trend in that zone.
8) When a reading seems “wrong”: drift, maintenance, and on-site validation
If one zone consistently reports higher humidity or lower temperature than the rest, you have two hypotheses: a real microclimate or a measurement error. Humidity sensors can drift over time, and dust, nutrient aerosols, or repeated condensation can affect response. Another trap is data “freshness”: an old, repeated value can look like stability. Before treating the crop as the problem, treat the instrument as a suspect and run a simple validation sequence.
What to observe: a sensor that no longer tracks events (vent openings, heating cycles) or stays outside the range of all others. What to verify independently: side-by-side comparison with a reference instrument, installation check, and a physical inspection of the housing/filter. Practical decision: do a basic audit—clean, reposition, then run a 24-hour test during normal greenhouse events. Check the result: if the difference persists and is repeatable, it is likely a real microclimate; if it disappears, you corrected the reading.
Conclusion
Uniformity in potted flowers is built through zone comparisons, not by chasing a single number. When a deviation appears, start with the mechanism: where non-representative air, condensation, radiation on the sensor, or local drafts can exist. Observe plants, validate with spot measurements, then act in the correct zone—and verify the effect over the next 24–72 hours.
If you use a platform like GrowGuard, rely on crop zones and alerts to see quickly where a change is real versus where a reading is suspect, without confusing “risk conditions” with diagnosis. A short invitation: build a seasonal “microclimate map” of your greenhouse and update it as layouts change; it helps reduce surprises and explain why two seemingly identical batches develop differently.