In potted-flower greenhouses, quality often hinges on small differences: a cooler corner, a wetter bench, a “dead air” area under benches or below hanging baskets. These micro-variations can shift flowering timing, alter compactness and foliage color, and create uneven batches that are difficult to ship to a consistent standard.
High humidity inside the plant mass is not just “humid air,” but a delicate balance among temperature, ventilation, evapotranspiration, and cold surfaces that can generate condensation. When leaves remain wet long enough, foliar disease pressure rises, and Botrytis becomes more likely under weak ventilation and high plant density.
That’s why a useful protocol is not “set a value and done,” but commissioning: decide what to measure, where to measure it, set site-appropriate thresholds, and verify in the crop whether actions actually improve uniformity. Below is a practical workflow: core mechanisms, what to observe, what to verify independently, and how to validate results with zone-based data rather than a single point.
1) Why uneven microclimate creates uneven plants
In potted flowers, temperature drives development speed and the pace of bud differentiation, while humidity influences transpiration and plant cooling. If two areas have similar temperatures but one has stagnant air and higher humidity, leaves may transpire less and growth can shift in internode length and tissue firmness. Night-time differences can also change days-to-flower even when the daily average seems “correct” on paper.
What to observe: rows that lag, pots drying unevenly, softer leaves in shaded areas or behind screens. What to verify independently: air distribution (cool smoke, light ribbons, a simple anemometer) plus inspection of cold surfaces (pipes, walls, corners). Practical decision: treat the greenhouse as zones and correct ventilation/heating distribution locally (where possible) before changing your overall crop recipe. Check the result: compare uniformity on the same batches after 7–14 days using field notes alongside sensor trends.
2) Humidity, dew point, and condensation: the mechanism that “switches on” risk
Relative humidity alone can mislead: 80% at warm temperatures does not mean the same thing as 80% when it’s cooler. Condensation forms when a surface (leaf, film, metal) drops below the dew point of the surrounding air and water deposits. In floriculture, moisture on leaves or flowers can compromise saleable appearance and open risk windows for disease. Importantly, sensors describe conducive conditions; they do not confirm the presence of a pathogen.
What to observe: droplets on foliage in the morning, “fog” between plants, water-soaked spots on petals, mold on plant debris. What to verify independently: look for inoculum sources (debris, planting material, irrigation water), because “good conditions for disease” are not the disease itself. Practical decision: use heating/ventilation to avoid cold surfaces and shorten leaf-wetness duration without over-drying the crop. Check the result: track whether condensation episodes (using estimated dew point) become less frequent and whether foliage dries faster after critical night-to-morning periods.
3) VPD as a shared language for temperature and humidity (and its limits)
VPD (vapor pressure deficit) translates the relationship between temperature and humidity into an indicator of the air’s “pull” for water from the plant. For potted flowers, VPD helps explain why in one zone with the same air temperature but higher humidity, the plant may transpire less, becoming more sensitive to physiological stress and disease. Remember: VPD calculated from air temperature and RH is an estimate; leaf temperature can differ from air temperature.
What to observe: zones with glossy or swollen-looking leaves, reduced transpiration, and substrate staying wet longer than elsewhere even under identical irrigation. What to verify independently: spot-check leaf temperature with an IR thermometer (hypothetical example) to see whether the leaf is cooler than air, which reduces the “real” VPD at the leaf surface. Practical decision: set zone-based VPD alerts and relate them to daily transitions (sunrise, screen closure, post-irrigation). Check the result: after ventilation or heating adjustments, VPD should become more stable between zones and growth-rate differences should gradually narrow.
4) Choosing sensors: what you measure and what you cannot infer
For microclimate in potted flowers, the useful minimum is air temperature and relative humidity, from which you can calculate VPD. Light (PAR or a fit-for-purpose light sensor) becomes critical where shading differs by bench or aisle, and CO2 can be relevant in spaces with controlled supply or highly variable ventilation. Don’t mix variables: a temperature sensor does not measure EC/pH, and EC does not tell you which nutrient is missing; it only indicates total dissolved salts in the measured medium.
What to observe: decisions made from a single “panel value” that doesn’t match crop reality inside the canopy. What to verify independently: basic calibration and plausibility (for example, if RH is stuck for hours, suspect sensor or placement issues). If you monitor fertigation, pH/EC require dedicated probes and you must specify the medium: source water, irrigation solution, drain, substrate extract—these are not equivalent measurements. Practical decision: define the question each sensor must answer (condensation, uniformity, screen management) before choosing quantity and type. Check the result: after 1–2 weeks, review how many actions were justified by data versus “alerts with no consequences,” then adjust thresholds and locations.
5) Zone placement: plant height and points with different airflow
A classic mistake is watching one point in the greenhouse and assuming all benches, racks, or hanging baskets share the same climate. In potted flowers, plant height matters: air 20–40 cm above the leaf can be much more humid than air at aisle level. Also, areas near doors, walls, corners, under screens, or beside heating pipes can create opposite microclimates within the same day.
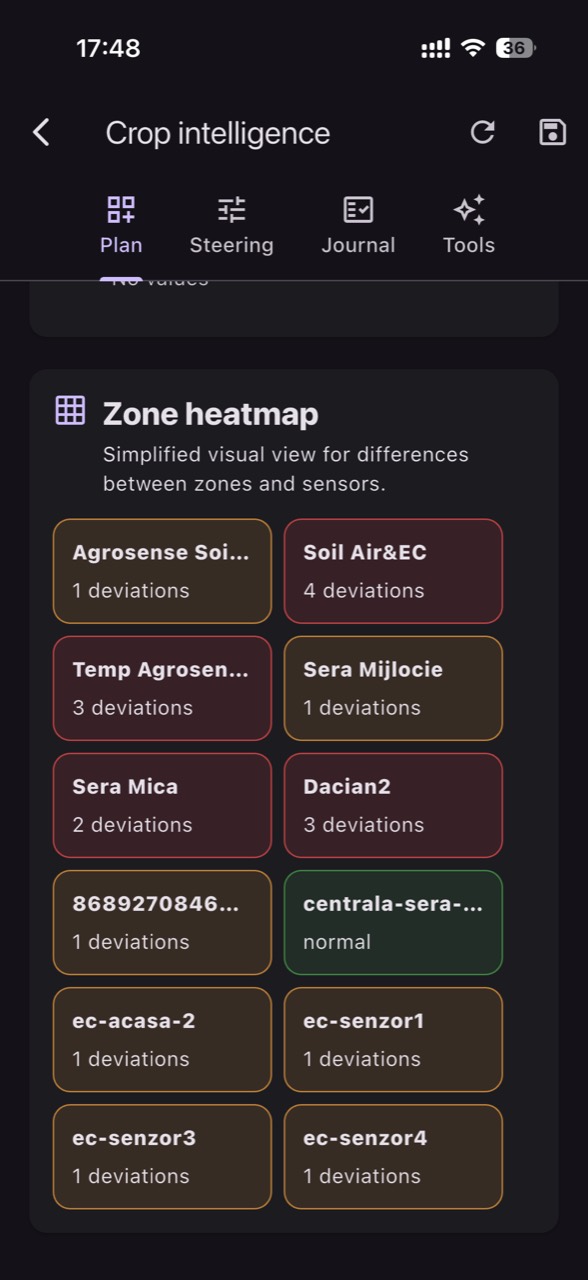
What to observe: systematic differences between benches (same irrigation, different results) and differences between upper and lower levels in hanging systems. What to verify independently: draw a simple airflow map (where air enters, where it exits, where fans push) and record obstacles (curtains, stacks, plastic). Practical decision: mount sensors at leaf height in each relevant zone and add at least one point in a suspected condensation area. In GrowGuard, you can separate the crop into zones to compare curves directly. Check the result: if zones are chosen well, their differences should explain what you see in plants; if curves look nearly identical but problems differ, your sensors are likely placed too conveniently rather than where plants actually experience the climate.
6) Commissioning workflow: from installation to thresholds that truly help
Commissioning starts with two checks: data freshness (how quickly values reach the platform) and units (°C, %RH, and kPa for VPD or an equivalent calculation). Then define critical episodes: night, early morning, after irrigation, after screens close, and during abrupt weather changes. Instead of picking “universal thresholds,” use history to mark moments when you had condensation or uneven growth and see which values and trends preceded them.
What to observe: alerts so frequent they don’t lead to action, or no alerts at the exact moments symptoms appear. What to verify independently: compare data with crop walk observations and a reference tool (for example, a handheld hygrometer) at 2–3 points to confirm sensors aren’t affected by direct jets or radiant heating. Practical decision: set different thresholds by zone and by time window (if your working method allows), because condensation risk typically peaks during transitions. Check the result: after tuning, the share of “useful” alerts should rise and time spent on unnecessary checks should fall; record each alert with the action taken and the outcome.
7) Typical interventions and how to validate them without changing the crop recipe
When one zone is too humid inside the canopy, the first temptation is to reduce irrigation everywhere. In floriculture, that can create water stress in already “good” zones and amplify unevenness. A safer approach is to correct the mechanism: local air movement, improved air distribution, screen management, zone-specific heating differences (if available), and disciplined spacing/arrangement. The goal is to shorten leaf-wetness duration and bring zone curves closer together.
What to observe: after an intervention, some pots dry too fast while others remain cold and wet; or temperature spikes appear on sunny afternoons. What to verify independently: run short tests (hypothetical example: 30–60 minutes of extra ventilation in one zone) and watch the temperature–RH–VPD response, not a single number. Practical decision: change one variable at a time; otherwise you won’t know what caused the shift. Check the result: compare before/after in the same time window and confirm in the crop whether visible moisture decreases and whether plants look more uniform after 5–10 days.
8) Failure cases: good data, wrong conclusions (or the reverse)
Sometimes the data looks perfect but the crop doesn’t: the cause may be that the sensor measures “clean air,” not the air within the plant mass. Other times the data is chaotic for technical reasons: a sensor in direct sun (overheating), placed beside a steam source, or suffering large transmission delays. For microclimate decisions, time resolution matters too: if readings arrive infrequently, you can miss the sunrise condensation peak entirely.
What to observe: implausible jumps, identical values for hours, huge differences versus what you feel in the greenhouse, or late alerts. What to verify independently: physically inspect placement (height, shading, protection), check power and communication status, and compare with a portable sensor for a few minutes. Practical decision: treat each anomaly as a two-branch hypothesis: a real microclimate problem or a measurement/transmission problem. In GrowGuard, status alerts and history can help differentiate, but the final confirmation happens on the crop walk. Check the result: after repositioning or correction, curves should become coherent and correlate with real events (vents opening, heating starting, irrigation).
Conclusion
Microclimate in potted flowers is not “fixed” by one setting; it’s improved by uniformity work: understand the mechanism (condensation, stagnant air, dew point), observe plants, independently verify sources and measurement quality, take a targeted decision, and then confirm the effect in both data and the crop. When you manage by zones, differences become explainable and controllable, and batches have a better chance of meeting the same standard.
If you want to build this workflow with zone sensors, alerts, and history, GrowGuard can be used as a monitoring and team-collaboration platform—without confusing monitoring with automation. A good first step is starting with 2–4 representative zones, commissioning placement and thresholds properly, then expanding only what has proven useful.