In potted-flower greenhouses, uniformity rarely collapses “all at once.” It erodes through small, repeated differences: a bench closer to the door, a shaded strip under the structure, a row with weaker air movement, or an irrigation line that is slightly out of tune. The result shows up as uneven height, staggered flowering, and inconsistent finish quality at shipping.
When you move into a monitored greenhouse, the temptation is to watch one “representative” point and generalize to the entire space. In floriculture, that is one of the most expensive assumptions you can make. Plants respond to the microclimate inside their own canopy, at leaf level and in the substrate, not to a greenhouse average.
This article explains a practical protocol for zone-based uniformity: how to define zones, which sensors to choose and where to place them, how to connect VPD to irrigation timing, and how to configure alerts that lead to action. For each issue, we cover the mechanism, what to observe in the crop, what to verify independently, the practical decision, and how to check whether it worked.
1) Why uniformity breaks: microclimate + water + growth rhythm
Potted flowers have a specific production constraint: the batch must look the same on the same day. Small differences in temperature and humidity alter transpiration, water uptake, and growth rate. In a stagnant-air pocket, leaf surfaces stay wetter, stomata behave differently, and plants may grow “soft” or lag. In a warmer pocket, evapotranspiration rises, pots dry faster, and size differences appear between benches.
What to observe: pots that feel noticeably different in weight after the same irrigation, foliage texture that differs between benches, flowering that comes in waves, and shifts in color intensity. What to verify independently: weigh a few “control” pots repeatedly at the same time of day, visually check runoff/drainge behavior (where applicable), and inspect emitter/nozzle uniformity along the line. The practical decision is not “more water everywhere,” but isolating the cause by zone; then confirm by re-checking pot weight and dry-down rate at the same points.
2) Zoning done right: how to divide the greenhouse so you don’t compare apples to oranges
In floriculture, a useful “zone” is not necessarily the heating sector on a schematic. It is an area that shares the same air behavior and the same water behavior. Draw zones using: proximity to doors and cold aisles, shading differences (structure, screens, overhead crops or hanging baskets), orientation to fans and vents, crop height (benches versus baskets), and irrigation type. A good zone is homogeneous enough that two control pots behave similarly.
What to observe: if two benches “in the same greenhouse” dry down on different schedules, they are not the same operational zone. What to verify independently: walk the house with a handheld temperature/RH meter at plant height during key moments (early morning, after heating starts, after irrigation). The decision: define 4–8 operational zones instead of treating the house as one climate. How to check results: after 1–2 weeks, pot-weight spread and growth variation should shrink inside each zone, even if contrasts still exist between zones.
3) Sensor choice and mounting: measure where the plant actually lives
For uniformity, the minimum combination is air temperature plus relative humidity (to estimate VPD), and—where irrigation decisions matter—substrate moisture sensors. In potted-flower houses, installation quality matters as much as sensor model: air sensors belong at canopy height, shielded from direct hot/cold jets and from splash. With hanging baskets, a warmer, drier air layer often forms above bench height, creating a different plant experience in the same bay.
What to observe: “perfect” graphs while the crop is clearly uneven usually means poor placement or poor zoning. What to verify independently: compare the installed sensor reading to a handheld instrument right next to it, and confirm that real events (vent opening, irrigation) produce a coherent change. The decision: mount at least one air point per zone and one substrate point in the most sensitive spot (for example, the bench that dries fastest). Verification: after relocation, between-zone differences should become clearer—not artificially disappear.
4) VPD in floriculture: mechanism, value, and practical limits
VPD calculated from air temperature and relative humidity describes the drying power of the air around the plant. On bright days, when VPD rises quickly, transpiration increases and pots empty faster. On humid days with low VPD, leaves dry slowly and moisture persists inside the canopy—conditions that can favor foliar disease development. Important limitation: air-based VPD is an estimate; leaf temperature can differ from air temperature, especially under strong radiation or in moving air.
What to observe: at higher VPD you may see firmer leaves, earlier light pots, and greater sensitivity to under-watering; at low VPD you may see leaves staying wet longer, condensation on structure, and higher risk of Botrytis in weak-ventilation pockets. What to verify independently: look for morning condensation, spot-check leaf temperature with an IR thermometer (hypothetical example for comparison), and assess whether air “hangs” between rows. The decision: use VPD as a rhythm indicator (how fast it changes), not a universal setpoint. Check the result: if you adjust ventilation/heating, leaf-wetness duration should shorten and substrate dry-down should become more uniform.
5) Watering on time: synchronize with light and VPD, not with the clock
In potted flowers, a common mistake is watering “as a block” at a fixed hour even though daily water demand shifts with light and VPD. If you irrigate too early on a cold, humid morning, the substrate can remain saturated for too long, oxygen availability drops, and growth becomes unbalanced. If you irrigate too late on a high-VPD day, plants cycle through intermittent water stress, which often amplifies variation in height and flowering timing.
What to observe: pots that remain heavy until evening (over-wet) or pots that become very light well before irrigation (under-wet). What to verify independently: weigh control pots before and after irrigation, check drainage/runoff behavior where it exists, and inspect distribution uniformity (pressure, filters, emitter performance). Practical decision: shift the first irrigation based on the onset of transpiration (light plus rising VPD), and schedule last irrigations so foliage can dry before night. Verification: the pot-weight curve becomes more similar across sub-areas of the same bench.
6) Alerts that actually help: zone thresholds, duration, and “confirmation”
Useful floriculture alerts flag persistent deviations, not a few minutes of noise. For example, a VPD or RH alert should include a duration condition (such as “beyond threshold for X minutes”) to avoid notifications triggered by every door opening. Likewise, substrate-moisture alerts must reflect zone dynamics: a drop that is too fast can indicate a dry sector, an irrigation fault, or simply a hotter microclimate that needs different timing.
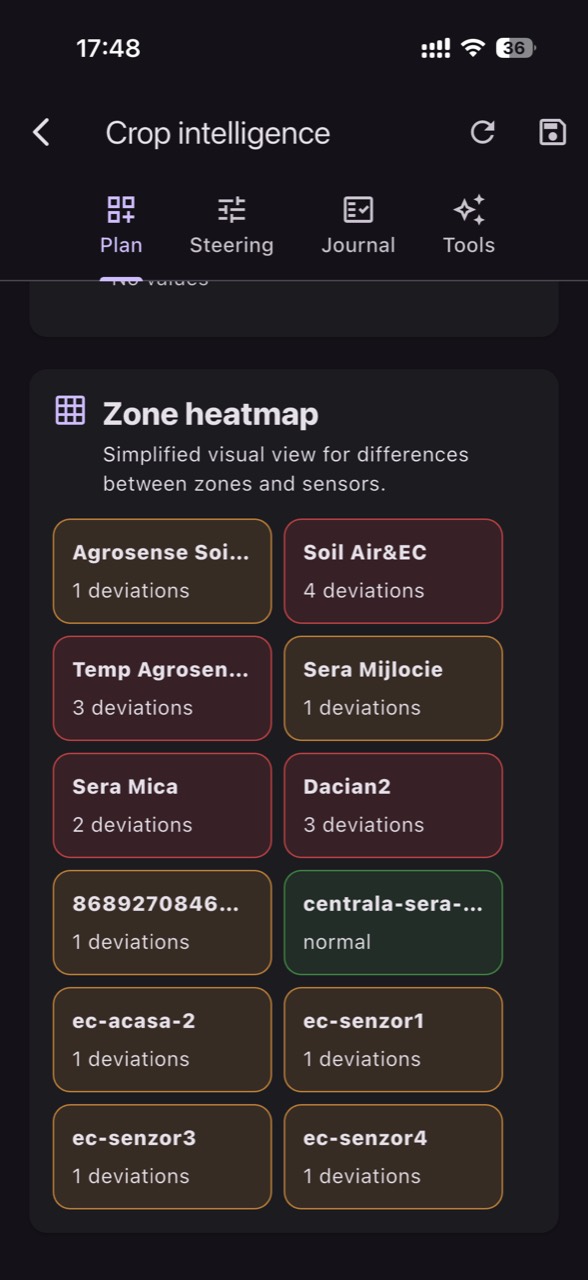
What to observe: frequent alerts without any matching crop issue usually indicates overly sensitive thresholds or a sensor placed in an unrepresentative spot. What to verify independently: go to the zone and confirm visually (condensation, wet foliage, light pots), then check physical causes (filters, drippers, fans, vents). The decision: configure different alerts by zone rather than “one rule for the whole greenhouse.” In GrowGuard, a practical approach is to tie alerts to real map-based crop zones so the team knows exactly where to check. Verification: after tuning, alert volume falls and each alert has a clear associated action.
7) Condensation, wet leaves, and Botrytis: the link to VPD and ventilation
High humidity inside the canopy and weak air movement increase the risk of Botrytis and other foliar diseases, but sensors do not detect a pathogen. They only indicate conducive conditions: long humid periods, large day–night swings, and cold surfaces that drive condensation. Disease sources can persist in plant debris, incoming plant material, or irrigation water; monitoring helps you identify when the microclimate becomes permissive, not confirm an infection or diagnosis.
What to observe: localized “humidity pockets” between benches, flowers or inflorescences that remain wet, and morning condensation on film or metal elements. What to verify independently: hygiene status (plant debris), actual airflow pathways (fan function, obstructions), and water/solution quality where relevant. The practical decision: reduce the duration of wet periods through ventilation/heating management and irrigation timing; in parallel, scout specifically in the alerted zones. Verification: track whether very-high-humidity windows shorten and whether symptom appearance decreases at those points—without confusing correlation with a guarantee.
8) Commissioning and audit: data freshness, units, and typical failure modes
In monitored greenhouses, decisions depend on data freshness (when the last reading was taken) and correct units. VPD is commonly expressed as a pressure value (often kPa), RH as %, and temperature as °C. For substrate, sensors may output volumetric water content or an index; what matters is consistency and comparability within the same zone and substrate type. A typical failure is an air sensor installed too close to a heater outlet or in a spot that is more ventilated than the crop canopy.
What to observe: impossible jumps (for example, RH suddenly spiking with no event), zones that look “identical” in data while plants differ, or missing data during critical hours. What to verify independently: keep a simple event log (irrigation, venting, heating), check the sensor physically (cleanliness, position, splash protection), and compare readings to a handheld tool. The decision: implement a weekly zone audit and treat sensors as instruments requiring verification, not absolute truth. In GrowGuard you can use sensor status/battery alerts to avoid losing hours of data. Verification: after the audit routine, recurring “anomalies” fade and the team’s trust in alerts improves.
Conclusion
Uniform potted-flower batches are built with zone control, not with greenhouse-wide averages: the same light perceived by the plant, the same water regime in the pot, and the same microclimate inside the leaf mass. VPD helps you understand transpiration rhythm and windows of persistent wetness, but it remains an air-based estimate. Irrigation becomes robust when it follows real demand and is validated by simple, repeatable checks at the same points.
If you want to turn these checks into a consistent team routine, a zone-based monitoring platform like GrowGuard can centralize readings and alerts without replacing greenhouse observation and independent verification. Start with zoning, two or three well-chosen control points, and a short loop: observe, verify, adjust, then confirm over the next days whether plant-to-plant differences truly shrink.