Rapeseed is a “details crop”: it enters winter with a specific architecture, then accelerates rapidly in spring. Two risks can completely change its trajectory—frost (especially during thaw–refreeze windows) and drought, which often arrives in episodes rather than evenly. That is why monitoring must be designed by zones, not by the farm average.
When we talk about frost, it is not only the minimum shown in a weather app that matters. What matters is the temperature at rosette level, how quickly air cools in low spots, whether the soil is wet or dry, and how soil temperature evolves in the root layer. Without local measurements, you can overestimate or underestimate risk in the very block that “enters stress first.”
For drought, rapeseed can look “green” for several days after the root zone has begun losing available water, especially on lighter soils or where the topsoil layer is shallow. A data stream from connected sensors (soil moisture and temperature, plus microclimate) helps you see the trend, verify it in the field, and decide in time: irrigate where possible, prioritize operations, and target scouting after events.
1) What frost does to rapeseed: mechanisms and early signs
Rapeseed cold tolerance depends strongly on growth stage and on the “quality” of going into winter: a well-formed rosette, a crown close to the soil surface, and a root system capable of supporting reserves. Risk rises in oscillating-temperature episodes: plants can lose part of their hardening during warm spells, then suffer damage when temperatures drop again. Wind also matters, because it accelerates heat loss at rosette level.
What you observe: differences between zones (field edges, depressions, shelterbelts), plants with cracked crowns, leaves with a “glassy” look after hard frost, or patches that restart slowly in spring. What you verify independently: check the crown and the bud, not just leaves; confirm the growth point is viable. A hypothetical practical decision: send the team scouting before rescheduling major inputs. Result check: repeat the assessment 3–7 days later, when regrowth becomes visible.
2) Drought in rapeseed: why “looking at the crop” is not enough
In drought, the core problem is a drop in available water in the root zone exactly when rapeseed accelerates water use (often in spring) or enters phases with high demand. The response is strongly shaped by soil texture and depth: on sandy soils the reserve can drop fast; on heavier soils you may have surface moisture but limited root access in cooler layers or where compaction restricts uptake.
What you observe: vigor differences in bands, basal leaves losing turgor during the hottest hours, uneven flowering, or reduced branching in weaker zones. What you verify independently: inspect a soil profile (simple spade check) to see moisture by layer and any compacted horizons. Practical decision: if irrigation exists, prioritize the zones that enter stress first; if not, prioritize scouting and operations that reduce losses. Result check: look for a stabilized moisture trend after rain/irrigation and a more uniform growth rhythm.
3) What is worth measuring in the field: parameters, units, and traps
For frost and drought, the useful core is: air temperature at a relevant height (not necessarily 2 m if you care about the rosette), relative humidity for microclimate context, and soil temperature at depths close to the active root zone. Soil moisture requires dedicated sensors (commonly volumetric water content or soil water tension/suction), and interpretation must be tied to soil type and local calibration. A temperature sensor does not tell you anything about pH or EC.
Common traps: comparing values from different media. EC, for example, can be measured in irrigation/fertigation solution, in substrate extracts, or in soil using different methods; results are not directly equivalent, and EC does not identify individual nutrients. If you monitor pH/EC, you need dedicated probes and must define the measurement medium. For decisions, follow trends and events (rapid drops, plateaus), not a “magic number.” Independent verification: periodically confirm with field profile checks and, when needed, laboratory analyses for water/soil; on-site monitoring complements, not replaces, lab work.
4) Choosing connectivity: NB-IoT vs LoRaWAN in rapeseed fields
In open fields, connectivity choice starts with reality: coverage, distances, number of points, and how often you need data. NB-IoT can fit where there is stable cellular coverage and you want rapid deployment without managing your own network. LoRaWAN can fit where you have many points across a larger area and can operate a network (via a gateway) or access an existing one. Either way, define data “freshness” from the start: for frost, minutes can matter; for drought, the trend over hours to days is typically the priority.
What you observe in practice: transmission delays, missing packets, batteries draining faster if you transmit too often or operate in weak signal. What you verify independently: compare the data log with a spot measurement (thermometer, soil profile observation) and confirm timestamps are correct (time synchronization). Practical decision: use different sampling intervals by season (more frequent during frost-risk windows, less frequent in stable periods) and set status/battery alerts. Result check: confirm alerts arrive on time and that data remains continuous through critical nights.
5) Placing sensors by zone: catching depressions, light soils, and field edges
Good rapeseed monitoring does not start with “the easiest place to reach,” but with a mental risk map. For frost, low areas and cold-air pooling zones are obvious candidates. For drought, zones with lighter texture, shallow topsoil, gravelly spots, or a history of stress are the first to lose available water. Ideally, you place paired points: a risk zone and a reference zone, so you can see the difference—not only an absolute value.
What you observe: if you install a single “average” point, you miss the moments when the weak zone enters stress days before the rest. What you verify independently: walk the field after a rain and after a windy/hot stretch to confirm the chosen points truly represent distinct zones. Practical decision: adjust placement after the first 2–3 events (rains, cold nights) rather than waiting for next season. Result check: differences between points should consistently match field observations; if they do not, suspect poor placement or faulty installation.
6) Commissioning protocol: installation, labeling, validation, and typical failures
A practical commissioning workflow starts with clarity: which decision you want to support (frost, drought, or both) and for which zones. Then: install the soil sensor at depths relevant to roots, with good soil contact (no air gaps) and cables protected from field operations. Position the air sensor so it is not artificially warmed by direct sun or reflective surfaces. Label each point with zone, soil type, depths, and installation date, so later comparisons remain meaningful.
Initial validation is not done only “in the platform.” What you verify independently: for soil, confirm with a nearby sample (feel consistency; check if the monitored layer is moist); for temperature, compare with a spot measurement at the same height/depth. Typical failures: a moisture sensor installed in a crack or next to a non-representative compacted spot; an air sensor exposed to radiation; “frozen” data caused by connectivity issues. Practical decision: before setting thresholds, collect 7–14 days of baseline data. Result check: look for a coherent response to rain (increase) and to dry days (gradual decrease).
7) Useful frost and drought alerts: local thresholds and in-field confirmation
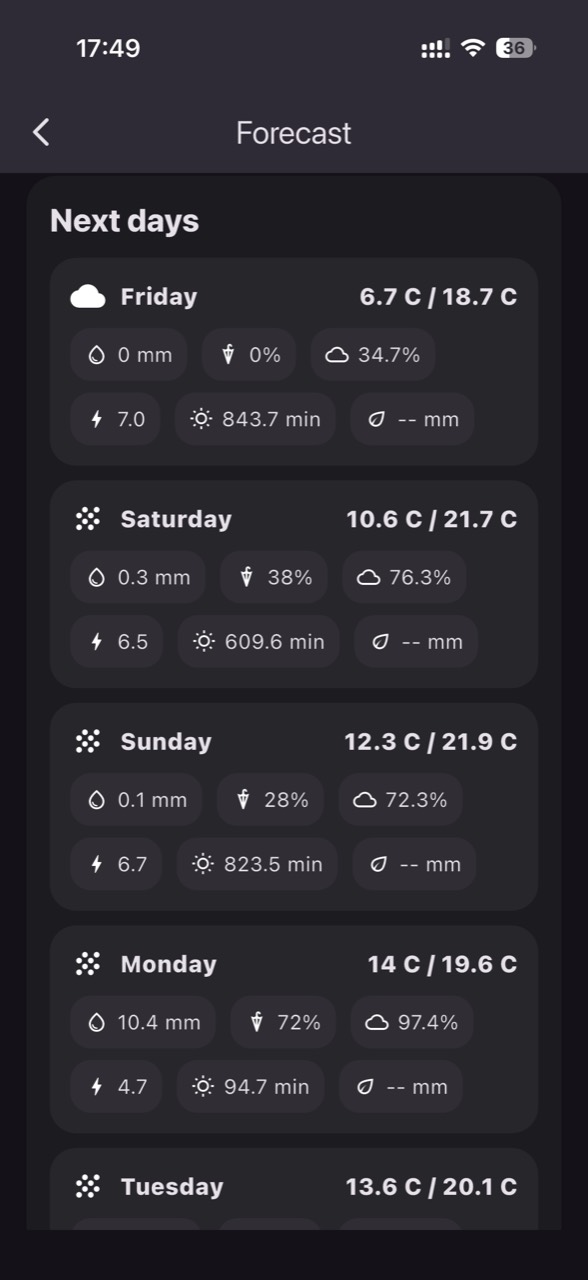
Good alerts trigger a clear action and reduce “alarm fatigue.” For frost, do not rely only on the day’s minimum; watch cooling rate, time spent below a locally chosen threshold, and differences between zones. For drought, it can make more sense to alert on trend (accelerating depletion) or on reaching a soil-specific critical level, rather than on a generic value. In GrowGuard you can set zone-based alerts and use forecast context, but thresholds must be built from your history and verified in the field.
What you observe: alerts that are too sensitive appear with every minor fluctuation and get ignored; alerts that are too wide arrive too late. What you verify independently: after a frost alert, inspect low spots early in the morning; after a drought alert, check soil profile and plant turgor at peak hours. A hypothetical practical decision: on a farm with limited irrigation capacity, alert the light-soil zone earlier so irrigation can start before growth rhythm is lost. Result check: compare moisture evolution after the intervention and visual uniformity a few days later.
8) Post-event interpretation: connecting data to real crop effects
After a cold night or a drought episode, the value comes from “closing the loop”: data → observation → decision → outcome. For frost, compare temperature curves between zones and identify where exposure was highest (lower minimum, longer duration). Then correlate with plant signs: delayed restart, reduced stand, branching differences. For drought, track how fast moisture recovered after rain and whether some zones lag behind—often a sign of poor infiltration or compaction.
What you verify independently: do not confuse water stress with other issues (pests, nutrient deficiency, compaction) just because “it was dry.” If you also monitor EC/pH in water or solution, remember these are different measurements than soil EC, and laboratory analysis remains the reference for composition; on-site pH/EC monitoring complements it. Practical decision: adjust next season’s point placement, sampling interval, and thresholds; if you plan an automation project, treat it separately from a monitoring platform. Result check: look for fewer “surprises”—events do not disappear, but become earlier and more clearly separated by zone.
Conclusion
Monitoring rapeseed for frost and drought works when it is built around mechanisms, not isolated numbers: where cold air pools, how water reserves drain on different soils, which growth stage is in play, and how quickly conditions can change. Connected sensors turn these differences into comparable history, but the decision remains agronomic and must be confirmed in the field—by checking the crown, the soil profile, and zone-by-zone uniformity.
If you want to operationalize zone-based data with alerts and history, you can use GrowGuard as a monitoring and team coordination platform. Start with a few well-chosen points, validate them after the first events, and only then expand—so the data truly changes decisions in your own fields.