Raspberries have a root system that is sensitive to excess water and they suffer quickly when the wet–dry swing becomes too large. At the same time, a dense canopy can create a humid, stagnant microclimate that keeps leaves and fruit wet for longer. That is why water management and airflow should be tied to measurements, not just routine.
In trellised row plantations, differences between row ends, edges, and low spots can be larger than they look during a quick walk-through. One measurement point “in the middle” does not describe the block correctly, and raspberries respond unevenly: some rows enter stress while others remain too wet. Sensors are valuable precisely because they let you compare zones, not because they deliver a single number.
Below is a practical protocol: what to measure (soil, air, leaf wetness), how to choose and place sensors, how to commission them so the data is credible, and what decisions you can make from it. For each issue you’ll see the mechanism, what to watch, what to verify independently, a practical action, and how to confirm the intervention worked as intended.
1) Raspberry specifics: why “too much” and “too little” can happen the same day
In raspberries, water stress often shows first in cane growth rhythm and in fruit size/firmness, while excess water harms roots by reducing oxygen and can favor root problems. With drip irrigation, short frequent events can keep the surface wet yet leave deeper layers unstable, especially on lighter soils. In protected crops, evapotranspiration can jump after ventilation changes or on a bright day, shifting demand faster than the root zone can respond.
What to watch in data: rapid soil-moisture swings after irrigation, persistent differences between rows, and periods when the air is warm/drying while the soil stays wet (or the reverse). What to verify independently: drip uniformity (pressure/flow), soil texture by zone, and drainage behavior after rain or longer irrigations. Practical decision: adjust irrigation duration and frequency by sector rather than the whole block. Result check: compare soil-moisture curves before/after the change and confirm in the field with simple checks (soil feel/structure, active roots, cane vigor).
2) Minimum sensor set: what each measures—and what it does not
For real control, a minimum set typically includes: soil moisture (water content or tension depending on sensor technology), soil temperature, air temperature and relative humidity (from which VPD can be estimated), and in dense areas a leaf-wetness sensor. Important distinctions: a temperature sensor does not measure pH or EC; EC and pH require dedicated probes, and you must state the measurement medium (irrigation water, fertigation solution, a soil/substrate extract) when comparing values.
What to watch: whether soil warms/cools differently across zones, whether air has high-humidity episodes that coincide with leaf wetness, and whether estimated VPD swings sharply when you vent. What to verify independently: soil-probe calibration/zero checks as per manufacturer guidance and spot comparisons against a reference thermometer/hygrometer. Practical decision: choose sensors that provide units and resolution that support interpretation (for example, clearly showing changes after an irrigation). Result check: during the first 7–10 days, look for consistency—similar irrigations in the same zone should create similar responses, without unexplained “jumps.”
3) Zone-based placement: avoiding the mistake of treating the block as uniform
Trellised raspberries create corridors of wind and shade: a row exposed to hot afternoon sun dries differently than one protected by windbreaks or by a tunnel edge. Placement should be designed around contrasts: rows with different exposure, row ends (where drip pressure can differ), edges, and low areas. A single central sensor can hide the exact problem that causes losses: a sector that dries too fast or a corner that stays cooler and wetter.
What to watch: consistent differences between zones at the same time of day (not only short spikes). What to verify independently: mulch condition, weed pressure (which changes evapotranspiration), and differences in topsoil depth or looseness. Practical decision: install at least two soil points for comparison and at least one microclimate point in the most “closed” canopy area. Result check: after placement, run a directed test day—apply an identical irrigation to sectors and confirm the soil-moisture response differs logically (faster on lighter soil, slower on heavier soil).
4) Commissioning: concrete steps to get credible data in the first month
Commissioning is not just “the sensor is transmitting.” It means the measurement makes agronomic sense, units are clear, and data is fresh enough for decisions. Start with three checks: (1) for each probe, record medium and depth—e.g., a soil sensor installed in the active root zone, not outside the wetted strip; (2) document reported units and reporting interval; (3) verify response to a controlled event (one irrigation and one pause). If there are data gaps, mark those periods as not interpretable.
What to watch: soil moisture rising after irrigation and then declining gradually; soil temperature showing thermal inertia rather than a sawtooth; air sensors showing a realistic day/night cycle. What to verify independently: physical placement (good soil contact, no air gaps), cable protection, and proper shielding of the air sensor so it is not heated by direct sun. Practical decision: set alerts only after you have 10–14 days of history; otherwise you will trigger “false alarms” due to installation effects or early-season transitions. Result check: repeat the controlled test after a larger rain/irrigation to confirm the sensor saturates and recovers correctly instead of sticking.
5) Irrigation with soil sensors: translating curves into actions
Instead of searching for a “universal threshold,” work with a practical concept: the zone’s operational window. Define it from your own history: the level where plants look good and grow steadily, and the level where stress symptoms begin—or where the soil stays too wet for too long. Then read two curve behaviors: amplitude (how far it dries between irrigations) and recovery (how quickly and how far it rises after irrigation). In raspberries, the aim is stability: aerated roots without big oscillations.
What to watch: after short irrigations, moisture rising only near the surface and then dropping sharply; or after long irrigations, staying elevated too long. What to verify independently: a small spade check beside the wetted strip to see whether water reaches the intended depth and whether there is local pooling; also check for clogged drippers in the “dry” areas. Practical decision (hypothetical): in a sector that dries too fast, shift from one long irrigation to two shorter ones to reduce amplitude. Result check: over the next days the curve should show gentler declines, and field observations (morning turgor, cane vigor) should become more uniform along the row.
6) Microclimate and VPD: linking ventilation, transpiration, and stress
Air temperature and humidity help you anticipate plant stress, not just worker comfort. From them you can estimate VPD—the drying power of the air. It is an estimate from air temperature and RH; leaf temperature can be cooler or warmer than air, so interpretation must include radiation, wind, and canopy density. In raspberries, episodes of very dry air can drive transpiration and increase root water demand exactly when the soil cannot supply it well (for example, if the root zone is cold).
What to watch: estimated VPD jumping after opening sides/vents or on a bright day, while soil moisture begins to fall faster. What to verify independently: stress signs at peak hours (slightly drooping leaves, or in severe cases edge scorch) and the uniformity of ventilation (dead zones with poor circulation). Practical decision: adjust ventilation to reduce long periods of stagnant air while avoiding abrupt shocks of extremely dry air on critical days, coordinated with a moderate preventive irrigation when appropriate. Result check: compare similar days before/after the change—similar radiation, but a more stable RH/VPD curve and a more predictable soil-moisture decline.
7) Leaf wetness and persistent moisture: a risk indicator, not “detection”
In dense canopy, the key issue is not only high relative humidity, but how long leaves and fruit stay wet after condensation, fog, or accidental wetting from irrigation splash. A leaf-wetness sensor does not detect Botrytis or any pathogen; it indicates a microclimate that can favor infection if it persists. In raspberries, high density, shade, and stagnant air can extend wetness duration even when outside air is dry. Place the sensor in the most closed area where drying is expected to be slowest.
What to watch: night-time leaf wetness correlated with high RH and moderate temperatures; mornings when leaf wetness persists long after sunrise in certain rows. What to verify independently: inspect the flagged areas (hypothetically, 20–30 m of row) for early mold on fruit or cane lesions, while also checking mechanical causes (irrigation wetting foliage, plastic damage, overly dense growth). Practical decision: open the canopy with crop work (cane thinning, tying), improve air movement, and adjust morning ventilation timing. Result check: in the following weeks, track shorter leaf-wetness duration and confirm in-field that drying occurs earlier without introducing additional water stress.
8) Turning data into a daily workflow: comparisons, alerts, and post-action checks
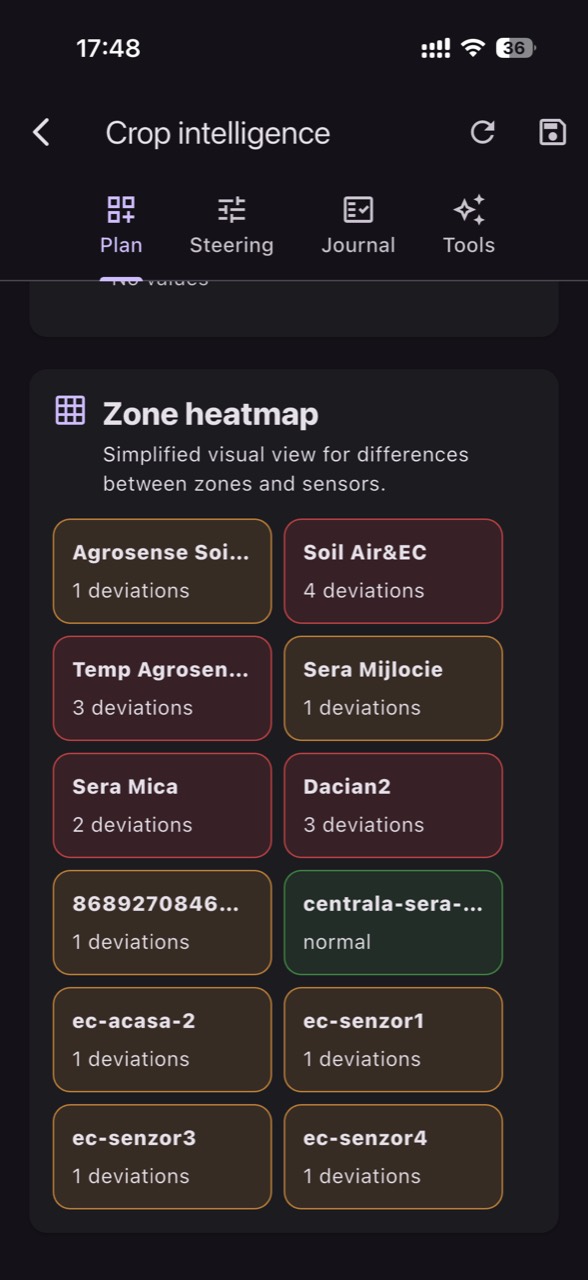
Data becomes useful when you build a routine: check the same graphs at the same times and log interventions. A simple raspberry workflow: in the morning, review whether leaf wetness occurred overnight and how RH behaved; at midday, check estimated VPD and the soil-moisture drawdown rate; in the evening, verify recovery after irrigation and whether any zones lag behind. If you use GrowGuard, zone separation and the sensor map help you spot which rows deviate from normal behavior and avoid “average-based” decisions.
What to watch: repeatable patterns (the same row dries faster every day) and sudden deviations (a sensor stops responding to irrigation). What to verify independently: when an anomaly appears, first check farm hardware (filters, pressure, row ends), then the sensor (position, contact, power/status). Practical decision: use alerts for events, not for “total control”: a soil alert for unusual drop, and a microclimate alert for long high-RH or leaf-wetness episodes. Result check: after each intervention, run a post-event review—compare 24–48 hours of data and note whether the intended effect appeared (more stable curves, shorter wetness duration, reduced zone-to-zone differences).
Conclusion
In raspberries, sensors pay off when they highlight zone differences and confirm whether an adjustment truly changed conditions in the root zone and canopy. The key is commissioning: clear units, correct placement in the wetted strip and in the “worst-case” microclimate, plus independent field checks. You are not chasing a perfect number, but stability—irrigations that support aerated roots and a microclimate that allows leaves and fruit to dry quickly.
If you want to structure this workflow with zone comparisons, history, and alerts, you can organize it in a monitoring platform such as GrowGuard, keeping monitoring separate from any automation project. Start with two or three contrasting zones, validate for two weeks, and only then expand the sensor network to the rest of the plantation.