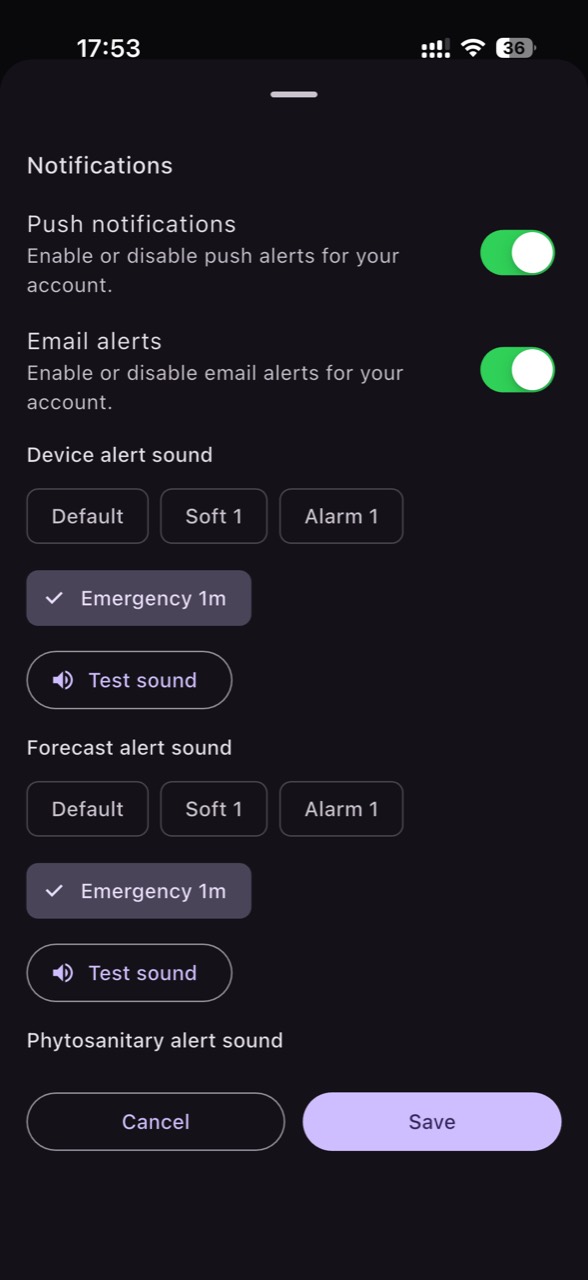
Alert thresholds become useful only when they translate data into clear actions: ventilate, irrigate, check a zone, pause a fertigation step, or send someone into the crop. The typical problem is twofold: “false” alarms that fatigue the team, and no alarm when something real happens. The fix is a commissioning workflow, not a list of magic values.
In horticulture, microclimate and the root zone change over meters, not hectares. That’s why applying the same “threshold” everywhere creates errors: drafts by doors, overheating under plastic, different flow at the end of a drip line, and substrates that dry differently than mineral soils. Thresholds must be defined by crop zones, then validated in practice.
This guide explains the technical fundamentals for temperature, humidity, VPD, moisture in soil/substrate, EC, pH and battery, then provides a commissioning protocol. For each parameter: the mechanism, what to watch in the graph, what to verify independently, a practical decision, and how to confirm the intervention worked. Examples are hypothetical.
1) Start with the purpose of the alert and the “decision unit”
A good threshold starts from a concrete operational risk: heat stress, leaf condensation, dehydration in the root zone, excessive salinity, pH deviation, or loss of data. Define the “decision unit”: who receives the alert, how fast they can react, and what they can realistically do. If the real response time is 30–60 minutes, thresholds must ignore 2–3 minute fluctuations that create noise rather than decisions.
Then define the zone: a greenhouse compartment, a row sharing the same irrigation, a block with the same soil type, or a group of pots on the same bench. Zone thresholds only work if data are fresh (a stable reporting interval) and units are correct (°C, %RH, kPa, mS/cm, pH). During commissioning, record the sensor’s physical location and what the zone represents (shading, ventilation pattern, end-of-line, slope).
2) Temperature: thresholds for stress, frost and uniformity—not just “too hot/too cold”
Mechanism: air temperature influences growth rate and transpiration, and it directly drives heat-stress risk; protected structures often show layering (warmer higher up) and short spikes in sun. What to observe: 24-hour trends, differences between zones, peaks after sunrise, and drops when vents open. A common failure is mounting a sensor in direct sun or near heating equipment, creating “alerts” that don’t reflect crop conditions.
Independent verification: place a reference thermometer (even a handheld unit) next to the sensor for 10–15 minutes, and check crop reality at leaf level (wilted patches, scorched margins). A practical decision might be adjusting ventilation or shading, blocking a cold draft, or scheduling irrigation earlier. Confirmation: after intervention, the temperature peak flattens and the zone-to-zone difference narrows; if not, airflow distribution is the problem, not the threshold.
3) Relative humidity: when alerting must be tied to condensation and time, not a single value
Mechanism: relative humidity (%RH) describes how close air is to saturation; near saturation increases the risk of condensation on leaves and structures, while very low RH accelerates water loss. What to observe: long high-RH periods at night, sharp rises after irrigation/misting, or drops after venting. An RH sensor that is poorly ventilated or mounted near water jets can report values “stuck” near 99%.
Independent verification: inspect leaves and plastic early in the morning for visible droplets; if possible, compare with a second point in the same zone to rule out a faulty sensor. A practical decision is a short venting pulse, slight heating to reduce RH, or shifting irrigation so evaporation doesn’t push RH upward before night. Confirmation: RH drops in the target window and, more importantly, the repeated window of observable condensation disappears.
4) VPD: thresholds that respect it’s an estimate and that leaves can be cooler than air
Mechanism: VPD (vapor pressure deficit) is derived from air temperature and relative humidity and expresses the “pull” the air exerts on plant water loss. It is useful for understanding transpiration and stress risk, but it remains an estimate: leaf temperature may differ from air (for example, cooling via transpiration or heating in direct sun). What to observe: VPD rising quickly after sunrise, dropping after irrigation/venting, and “teeth” when fans start.
Independent verification: if you have a handheld IR thermometer, hypothetically measure leaf temperature in two zones when VPD looks “alarming”; a consistent difference from air explains why plants may not show stress (or why they do despite modest VPD). A practical decision is reducing heat load (shading, ventilation), adding humidity only when agronomically sensible, or adjusting irrigation timing to avoid midday wilting. Confirmation: VPD stabilizes and stress signs (drooping leaves, tip burn) do not expand over the following hours.
5) Soil/substrate moisture: thresholds by depth, irrigation response, and “dry-down speed”
Mechanism: soil/substrate moisture sensors measure water content (volume-based or volumetric percentage), but interpretation depends on soil texture, bulk density, salts, and good contact with the medium. In substrates (coco, peat) dynamics are fast; in mineral soils, slower and layered. What to observe: the rise after irrigation and the slope of decline; differences between end-of-line and mid-line; zones that don’t “jump” after irrigation (possible clogged dripper) or stay high (overwatering, poor drainage).
Independent verification: do a manual check (probe, small profile, pot weight) at the sensor point, plus an irrigation inspection (flow, pressure, uniformity). A practical decision is adjusting irrigation duration/frequency, or splitting one zone into two if responses are consistently different. Confirmation: after changes, the curve becomes repeatable: rise at irrigation, predictable dry-down, no long saturation periods, and no drops below the level at which the crop enters visible stress (as observed in the plants).
6) EC: choose the correct medium and avoid mixing water, solution, substrate extract and soil
Mechanism: EC (electrical conductivity) indicates dissolved salts, not individual nutrients. More importantly, EC depends on the measurement medium and method: EC in irrigation water, EC in fertigation solution, EC from a substrate extract, and EC in bulk soil are different measurements and should not be directly compared. On-site pH/EC monitoring complements laboratory analysis rather than replacing it; water, solution, substrate extract, and soil each require different interpretation.
What to observe: gradual increases (salt accumulation), step changes after a recipe change, and drops after leaching or rainfall (in field conditions). Independent verification: confirm with a calibrated handheld conductivity meter and explicitly record what you measured (hypothetically: “EC in tank solution” versus “EC in drainage” versus “EC in extract”). A practical decision is adjusting leaching/drainage strategy or checking fertilizer dosing. Confirmation: EC returns to the expected trend and symptoms consistent with salinity (leaf-edge burn, slowed growth) stop intensifying.
7) pH: thresholds for deviations and trends, with verification and electrode maintenance
Mechanism: pH affects nutrient availability, but pH sensors are sensitive to deposits, drying, temperature effects, and require periodic calibration. That’s why alerts should track both out-of-range values and slow drift that may signal a real solution change or a sampling/electrode problem. What to observe: a pH that was stable and starts “floating,” values that jump on every reading, or a pH that stays fixed for hours (possible stuck sensor).
Independent verification: measure with a freshly calibrated portable pH meter and, where relevant, compare pH in source water, fertigation solution, and drainage (different media). Practical decision: before changing recipes, verify the sensor first (cleaning, calibration), then investigate agronomic causes (alkalinity, water-source change, precipitates). Confirmation: after intervention, pH shows logical continuity and aligns with the reference measurement; if not, the issue may be installation-related (bubbles, insufficient flow) or sensor-related.
8) Battery and “data health”: thresholds that prevent losing context
Mechanism: a battery or status alert doesn’t protect the plant directly, but it protects the decision: without data you can’t tell whether a zone is in a critical event or simply “silent.” What to observe: unusually fast battery decline, gaps in reporting, frozen values, or unrealistic jumps (possible reset, communication issues, poor contact). During commissioning, define what “fresh data” means for your operation and when missing data becomes a risk.
Independent verification: physically check sensor placement, cable/probe integrity, and—if using radio networks—new obstacles (metal doors, films, a moved gateway). Practical decision: replace the battery, change the reporting interval, or relocate the sensor for stronger signal. Confirmation: data return to the normal rhythm and “phantom” alerts disappear. In a monitoring platform such as GrowGuard, battery and status thresholds can be set by zone so the team intervenes before useful history becomes fragmented.
Conclusion
A good alert system is not about finding a perfect number; it is about building a verifiable loop: observe a pattern, confirm it with an independent check, take a proportional decision, then verify the effect in both data and crop. When thresholds are tied to real zones and to time (duration, trend, repeatability), the alert count drops and relevance increases.
If you use a monitoring platform such as GrowGuard, treat thresholds as continuous commissioning: review them after seasonal shifts, crop-stage changes, or irrigation/ventilation interventions. A short invitation: start with 2–3 critical alerts on one pilot zone, validate them for a week, then expand to the rest of the zones with the same verification discipline.