In a greenhouse, orchard or monitored field block, confusion often starts when a chart shows a sudden deviation. Temperature rises too quickly, soil moisture stays flat, EC looks impossibly high or one sensor disappears for several hours. The first reaction is often to assume that either the crop or the system has failed, but good diagnostics begin with a calmer reading of the evidence.
A deviation can have at least three explanations: the crop environment really moved outside its normal pattern, the sensor is measuring badly, or the data did not travel correctly through the network. Each case needs a different action. Treating a connectivity issue as an irrigation problem wastes time. Ignoring a real deviation as a sensor glitch can hide an important risk.
GrowGuard helps by placing the value next to history, sensor location, communication status and comparison with other monitoring points. The app does not replace field inspection, but it narrows the uncertainty: you can see whether the deviation is isolated, repeated, linked to weather forecast conditions or accompanied by signs that the sensor is no longer reporting reliably.
Three problems that can look identical on a chart
A real crop problem means the environment has changed: the soil is drying, the air remains too humid, temperature drops in a cold zone or salinity accumulates in the substrate. In that case, the measurement is an agronomic signal and should be checked beside the plants. The key question is whether the event appears in a coherent area and whether it matches what you observe in the crop.
Sensor drift means the reading gradually moves away from reality even though the environment has not changed in the same direction. A network issue means readings may be missing, delayed or arriving in jumps. On screen, all three can look like an anomaly. That is why diagnostics should not rely on one value only, but on time, location, neighbouring sensors and device status.
Start with crop observation, not a technical assumption
The first step is to ask whether the deviation makes sense for the time of day and for recent operations. After irrigation, soil moisture can rise. After ventilation, relative humidity can drop. On a cold night, the edge of a tunnel may cool faster than the centre. If the value matches weather or farm work, it is not necessarily an error.
Field inspection remains essential. Look at leaves, substrate, drippers, condensation, air movement and uniformity. If the sensor indicates drought while the substrate is visibly saturated, you have a reason to review placement or probe contact. If the plant confirms the signal and the same zone repeats in history, you probably have a real situation that deserves action.
How to recognise drift or poor sensor placement
Drift is rarely dramatic on the first day. It often appears as a slow slide: one sensor reads slightly higher or lower than comparable points, and the difference grows over time. With pH and EC, deposits, weak contact, medium temperature, a drying probe or lack of checks with reference solutions can change interpretation. With soil moisture, root contact and soil texture strongly influence the reading.
Poor placement is not the same as a defective sensor. A probe beside a dripper can detect fresh water while the active root zone remains uneven. An air sensor too close to plastic film, a door or a fan may describe that microclimate, not the crop average. Before changing thresholds, compare with a reference point and record exactly where the sensor is installed.
Signs that the issue comes from LoRaWAN, NB-IoT or MQTT
With LoRaWAN, typical signs include long gaps between uplinks, values arriving in batches, low battery, weak signal or packet loss when the device is shielded by metal, water or greenhouse structure. With NB-IoT, check operator coverage, reconnect behaviour and energy consumption under weak signal. An old value can look current if you do not check the last transmission time.
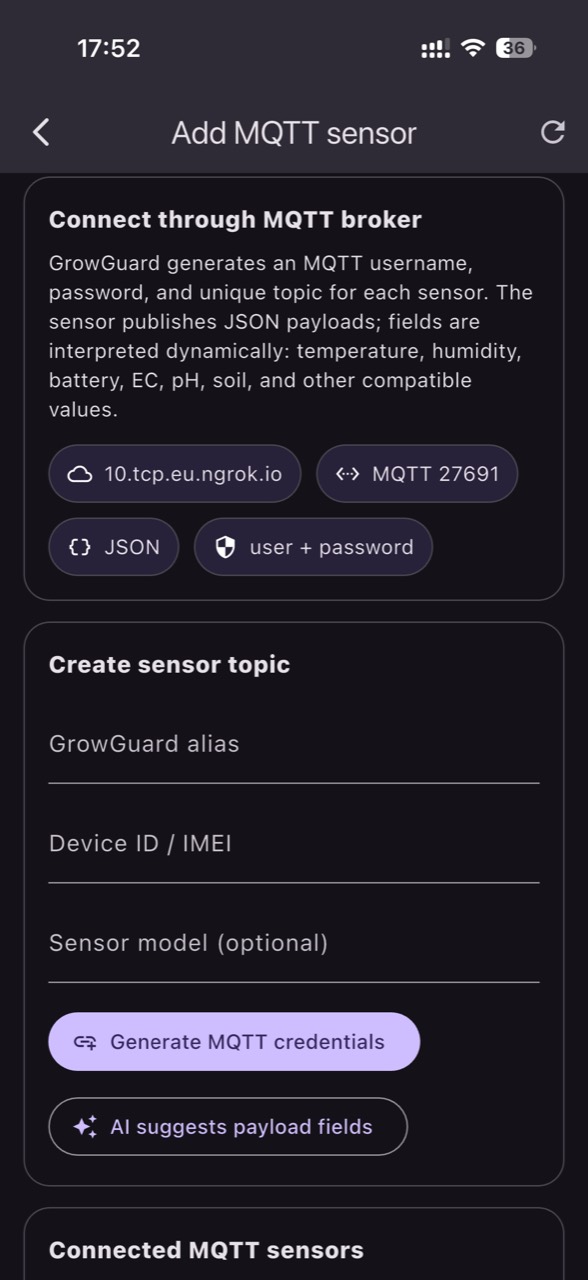
With MQTT, diagnostics move toward the broker, topic, authentication, JSON format, units and timestamp. A message can arrive correctly but on the wrong topic. It may use Fahrenheit instead of Celsius, another EC unit or renamed fields after a firmware update. The integration should be tested with a real payload, real time and confirmation that each measurement lands in the correct field.
Timestamp, units and data freshness
A simple rule helps: never judge an alert without checking how fresh the value is. A reading transmitted three minutes ago is very different from a value that has not changed for five hours. In a greenhouse, one hour can completely change temperature, relative humidity and estimated VPD. For operational decisions, measurement time is almost as important as the value itself.
Units can create mistakes that are difficult to notice. EC may be expressed differently depending on equipment and medium, pH requires the right sample and method, and soil moisture may be volumetric, relative or reported on the manufacturer’s own scale. GrowGuard can centralise the data, but a good integration must preserve the unit, channel and meaning of every measurement.
Compare zones, not only absolute values
One isolated sensor tells a short story. Two or three well-chosen points tell a much more useful one. If all zones behave the same way, the cause may be weather, irrigation strategy or a shared operation. If only one zone deviates, look for differences in ventilation, shade, dripper flow, soil texture, slope, drainage or position near doors and plastic film.
Compare the rhythm as well as the value. A zone that dries faster after every irrigation may have more active roots, different flow or higher losses. A zone that stays cool in the morning can extend condensation and disease pressure. When the same pattern repeats over several days, the decision becomes clearer: adjust locally, inspect the installation or move the sensor to confirm the diagnosis.
Alerts that separate urgency from noise
A good alert should not trigger on every fluctuation. It should consider duration, severity and context. A short threshold crossing may be normal after doors are opened or irrigation starts. A deviation that lasts through the night is different. For phytosanitary risk, the accumulation of favourable conditions matters more than one reading. Monitoring indicates risk; it does not confirm pathogen presence.
Sensor status should be handled separately from agronomic alerts. An offline sensor does not automatically mean a crop problem, but it does mean that visibility is reduced. Low battery, delayed transmission or a string of identical values should be signalled as data-quality risk. The team then knows when to inspect the crop and when to inspect the monitoring infrastructure.
A simple daily diagnostic workflow
A practical workflow can start each morning with three questions: which sensors reported recently, which zones moved outside their usual pattern and which values match the forecast or yesterday’s operations? Then choose two field checks, not ten. The goal is not to chase every chart, but to use data to prioritise the most likely causes.
After action, check the result. If ventilation was changed, watch how humidity moves over the following hours. If irrigation was adjusted, follow the drying curve and compare it with a reference zone. If a probe was moved, record that internally. Data becomes valuable when each intervention leaves a lesson that improves the next decision.
Conclusion
The difference between drift, network trouble and a real crop problem is not always visible in one reading. It appears over time, through comparison, field verification and integration quality. A useful monitoring system should show not only the value, but also how recent it is, where it was measured and whether the sensor itself looks healthy.
For horticultural farms, greenhouses, tunnels, orchards or vineyards, this discipline turns sensors from simple devices into decision tools. GrowGuard can help the team see deviations more clearly, avoid false alarms and act where the data and the crop tell the same story.