The real microclimate inside a crop rarely matches the “weather near the yard”. In a greenhouse, a dead-air corner can condense at night; in a tunnel, the ends behave differently; in an orchard, a low spot traps cold air; in a vineyard, slope and row exposure quickly change humidity. If the sensor is not where the phenomenon happens, the data becomes misleading.
A useful placement guide has to explain the mechanism (why differences form), what to watch in graphs, what to verify independently in the field, and what practical decision you can make. Just as important is checking after an intervention: otherwise you may confuse a crop response with a mounting error or with a transmission delay.
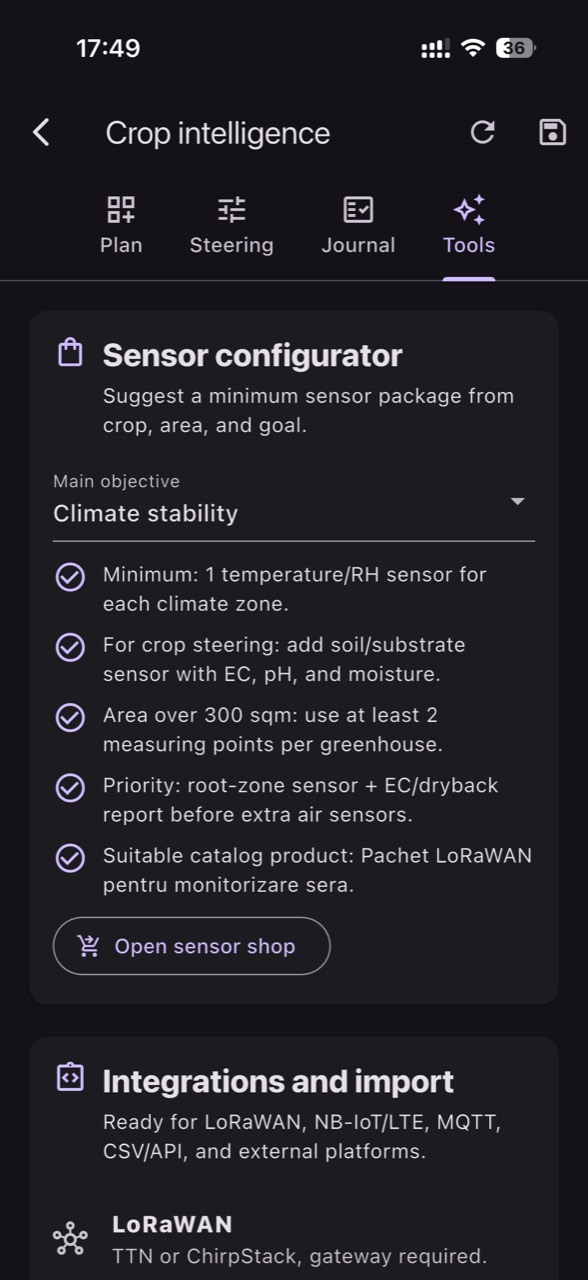
Below is a commissioning workflow you can apply in greenhouses, tunnels, orchards, and vineyards. You won’t find “universal setpoints”, but steps to produce correct, comparable, actionable measurements: choosing the right sensor type, placing sensors by decision zones, checking units and measurement media, and simple validation tests to confirm the sensor truly represents the block you manage.
1) Define the problem: which risk you want to see, and which zone drives a decision
Start with a mental map of risks, not a shopping list of sensors. In protected crops, the typical risk is the temperature–humidity combination (condensation, stress, disease windows) and uniformity by zone. In orchards, late frost by phenological stage matters, as do differences between blocks and wet-leaf periods. In vineyards, microrelief and exposure shift both minimum temperature and leaf-wetness duration, directly affecting disease pressure.
What to observe: if two points look almost identical, you either have a uniform zone or you placed sensors in the same microclimate type. Verify independently: walk the crop early morning after a clear night and look for localized frost/fog, leaf wetness, windy gaps, or sheltered pockets. Practical decision: split the farm into “decision zones” (e.g., tunnel end, middle, low orchard block, hillside). Check the result: after 1–2 weeks, differences between zones should be consistent and explainable by terrain/structure, not random.
2) Choose sensor type by mechanism and measurement medium, not by marketing name
Air temperature and relative humidity must be measured in air, with radiation shielding and mounting that avoids contact with surfaces that heat or cool. Soil moisture must be measured in soil, at depths that match the active root zone and the irrigation method. EC and pH require dedicated probes, and you must clarify the medium: EC in irrigation water, fertigation solution, substrate extract, or bulk soil are different measurements and cannot be compared directly.
What to observe: unit mismatches or “jumps” that appear only because you are comparing different parameters or methods. Verify independently: document for each point what it measures and where (air/soil/substrate/water), plus the unit (for example °C, %RH, kPa for VPD, conductivity units for EC). Practical decision: do not try to “infer” EC/pH from temperature, or the reverse; if you need nutrition control, plan specific probes and procedures. Check the result: when reviewing graphs, compare only time series measured in the same medium and with the same method.
3) Height, shielding, and orientation: avoiding air-reading errors in greenhouses and tunnels
In greenhouses and tunnels, the common failure is exposing the sensor to direct sun or placing it near hot/cold surfaces (pipes, walls, film), which biases temperature and therefore VPD. VPD computed from air temperature and RH is an estimate; leaf temperature can be cooler or warmer than air, especially near vents, in drafts, or in shaded zones. That’s why the air sensor must represent “the air the crop breathes”, not a technical corner.
What to observe: midday temperature spikes that do not match plant behavior, or apparently low humidity while visible condensation exists. Verify independently: spot-check with a portable thermometer/psychrometric tool at two moments (early morning and midday), and confirm the sensor is shaded and naturally ventilated. Practical decision: if data indicates high nighttime humidity, adjust ventilation/heating according to your strategy—but only after confirming the sensor is not in a fan jet or too close to film. Check the result: after the change, look for shorter duration of high humidity and correlate with reduced condensation during inspections.
4) Zoning inside protected structures: ends, aisles, and heating differences
A single “central” point rarely describes a long greenhouse or a tunnel with exposed ends. Ends have infiltration, doors, wind effects; zones near vents have different temperature profiles; and aisles can create drafts that dry the air without reflecting conditions inside the leaf canopy. The mechanism is simple: air exchange and solar load are not uniform, and plant mass locally alters evapotranspiration and humidity.
What to observe: persistent differences between ends and middle, especially on cold evenings or windy days. Verify independently: do a quick walk with a handheld meter and note whether the same differences appear at the same time of day. Practical decision: set at least two air points in long structures (hypothetical example: one at an end and one mid-structure), and if you have very dense vs. sparse crop areas, treat them as separate zones. Check the result: when you change ventilation or shading, the effect should appear where you act and not disappear in an average; a platform like GrowGuard helps when you view readings by zone rather than one aggregated number.
5) Orchard frost: why “critical height” and topography decide accuracy
In orchards, late frost damage depends on phenological stage and how cold air drains and pools. On clear nights, a common mechanism is inversion: cold air collects in low spots while slopes may stay warmer. If the sensor is mounted too high, near a road, or close to a building, you will underestimate risk in the vulnerable block. Temperature points should therefore be chosen specifically for areas prone to “cold-air pockets”.
What to observe: different nightly minima between blocks, sometimes with a 1–2 hour offset. Verify independently: after a cold event, look for uneven signs (frost only in the valley, bud damage limited to one zone) and compare with sensor history. Practical decision: place one sensor in the low spot and one in a higher “control” area; configure alerts per zone, not globally. Check the result: after a critical night, confirm the low zone reached risk thresholds first and whether interventions (hypothetical example: starting an existing frost-protection system) coincided with temperature stabilization at the vulnerable point.
6) Leaf wetness in orchards and vineyards: what it measures, where to place it, and what not to confuse
A leaf-wetness sensor does not “detect” a pathogen; it estimates the duration of moisture on a surface that imitates a leaf. For disease risk, the relevant mechanism is wetness duration combined with temperature: rain, dew, fog, or condensation can create different windows even between rows. Bad placement (under a canopy drip edge, directly hit by sprinklers, or overly exposed to wind) can overestimate or underestimate wet hours.
What to observe: long “wet” periods without dew or rain, or the opposite—wet leaves in the block while the sensor reads “dry”. Verify independently: early morning, compare the sensor surface with real leaves in that zone (touch, droplets, condensation). Practical decision: use leaf wetness as a risk indicator and a trigger for targeted scouting, not as diagnosis; in vineyards, place it in a canopy microclimate that represents the block, avoiding the exposed edge. Check the result: after a wet period, verify whether zones with many wet hours also show early field signs (for example, suspicious spotting) and adjust placement if there is no correlation.
7) Soil sensors: depth, distance to drippers, and irrigation verification
For soil moisture, the main issue is representativeness of the root volume and the irrigation application pattern. Under localized irrigation, wetting is uneven: right next to a dripper the profile differs from mid-row. If the probe is too close to the emitter you may conclude “soil is always wet”; too far, you may report drought even when roots access water. In orchards and vineyards, root exploration also varies with rootstock, texture, and compaction.
What to observe: sharp increases at every irrigation with no gradual decline between events, or nearly flat readings regardless of scheduling. Verify independently: during an irrigation, check manually (probe, spade, visible wetting front) whether the sensor “sees” the event on a realistic timeline; also inspect the system (clogged drippers, pressure issues). Practical decision: install at least two depths in the same zone (hypothetical example: a shallower depth for active roots and a deeper one for drainage), and position relative to the drip line according to local practice and root distribution. Check the result: after changing duration/frequency, the upper layer should respond quickly while the deeper layer confirms you are not pushing water too deep—or, conversely, that you are not staying too shallow.
8) Commissioning and maintenance: data freshness, drift, and “false alarms”
After mounting, the first days are a data-quality test. Check data freshness: if transmission is delayed, you can make decisions on old data, especially during frost or nighttime humidity episodes. Look for typical misinstallation signatures: daytime temperature too high (radiation error), humidity “stuck” at 100% (condensation on sensor), soil readings stuck (poor soil contact). Do not confuse a network issue with a real change in the crop.
What to observe: gaps in the series, perfect step changes, or suspicious synchronization (multiple sensors “jump” identically). Verify independently: keep a log of interventions (sensor moved, irrigation run, vents opened) and compare with the graph; cross-check with a handheld meter. Practical decision: adjust alerts only after you have about a week of clean data; thresholds must be calibrated to site and phenology, not copied. Check the result: when an alert triggers, follow a field-confirmation routine; in a platform like GrowGuard, zone alerts are useful only if sensors were commissioned correctly and you then verify the intervention effect in the history.
Conclusion
A “correct” microclimate picture is not a single precise number—it is a measurement system that represents the zones where you actually make decisions: tunnel ends, cold corners, low blocks, slopes, and rows with different soils. Physical mechanisms (radiation, wind, inversion, wetting fronts) tell you where to place sensors; independent checks tell you if you are right; and post-intervention checks show whether the data is actionable.
If you treat placement as commissioning—not as a one-time installation—you reduce false alarms and increase team trust in the data. As a next step, you can configure zones and alerts in GrowGuard so each sensor maps to a real decision in your greenhouse, tunnel, orchard, or vineyard, then validate each important alert in the field during the first weeks.