The most common mistake in soil monitoring is not the sensor choice—it’s the point choice. A sensor installed “where it’s convenient” can perfectly describe an atypical corner: a row end where water accumulates, a patch with different texture, or a drip line that is partly clogged. The outcome is predictable: you irrigate according to a soil condition that doesn’t match the plant’s root zone.
A correct strategy starts with the idea of a zone: parts of a field or protected structure that behave differently with water and nutrients. Zones show up in crop uniformity, drying time after irrigation, salinity patterns, and even disease pressure. Sensors become useful when they are anchored to these differences, not when they are treated as “average values” for the whole site.
This article covers the technical fundamentals and a usable commissioning workflow: how to define zones, how to choose depths and the measurement medium (soil vs. substrate), what to verify independently (moisture profile, infiltration, sampling), how to set relevant alert thresholds, and how to validate after the first irrigation and fertigation cycles. All examples are hypothetical so you can adapt the protocol to your farm.
1) Start with a variability map, not with the number of sensors
Mechanism: soil is not uniform, and irrigation makes it even more “compartmentalized.” Texture, compaction, slope, drainage, shade, and sector flow differences create distinct dynamics: some areas wet quickly and dry quickly, others stay wet and accumulate salts. What to observe: smaller plants, darker/lighter foliage, harvest differences, ponding or crusting, and vigor changes along rows are practical indicators that zones exist before any sensor is installed.
Independent verification: walk the site after an irrigation event and again 24–48 hours later. Do 6–10 shovel inspections at root-relevant depths and note where the wetting front is too shallow, too deep, or uneven. If possible, relate what you see to a simple map: slopes, soil types, irrigation sectors. Practical decision: define 2–4 initial zones (not too many). Result check: once sensors are installed, moisture curves should differ between zones in an explainable way (for instance, a sandier zone reacts faster).
2) Choose “representative” points, but keep a control point too
Mechanism: a representative point is where the plant “decides” production—active roots, real water delivery, no short-circuits (cracks, preferential channels), and no artificial influences (edges, walkways, runoff). What to observe: border rows, areas near roads, doors/vents, tanks, or frequently walked strips tend to generate distorted readings. In open fields, row ends are often different because pressure, distribution, and maintenance effects are rarely uniform there.
Independent verification: before fixing the location, check irrigation uniformity locally. Place 2–3 temporary verification spots (for example, small inspection digs or observation tubes) within a few meters and compare infiltration and wetting after the same irrigation. Practical decision: in each zone, select one representative point and one “control” point designed to warn early about risk (typically the fastest-drying spot). Result check: if the control point consistently enters stress while the representative point does not, you likely have a real risk area—not a false alarm.
3) Depth and position relative to drip: where the active root zone forms
Mechanism: the sensor must “see” the zone where roots take up water and where salts concentrate. Under drip irrigation, distribution is not uniform; a wetting bulb forms with steep gradients laterally and vertically. What to observe: a probe too close to the emitter can overestimate how well the crop is watered; too far away it can report drought even while roots still access water. In shallow-rooted crops, a probe set too deep responds slowly and can miss stress onset.
Independent verification: after an irrigation, mark the emitter position and dig a narrow cross-section (hypothetically, in a drip-irrigated vegetable bed) to visualize the wetted contour. Adjust placement so the probe sits inside the wetted zone but not in the saturated “core.” Practical decision: install two depths in the same zone (shallow + deeper) when you need to manage both stress and deep percolation. Result check: after irrigation, the shallow sensor rises quickly; the deeper sensor rises only if you pushed water too low or the profile was already wet.
4) Moisture, EC and pH: not the same thing, and not directly comparable
Mechanism: moisture indicates water availability, EC indicates total dissolved salts, and pH indicates acidity of the measured medium. They influence each other: as soil dries, EC in the soil solution can increase; after irrigation, EC may drop by dilution or rise temporarily if fertilizer is applied. What to observe: EC swings without moisture changes may indicate a fertigation recipe change, deposits, or a probe sitting in a localized “salt pocket.”
Independent verification: always compare EC within the same measurement method and medium. EC of irrigation water, fertigation solution, substrate extract, and bulk soil are different measurements and do not convert cleanly. On-site pH/EC monitoring complements laboratory analysis; it does not replace it. Practical decision: use dedicated EC/pH probes and label the medium explicitly (soil, substrate, solution). Result check: after a recipe change, expect coherent timing—EC changing in step with irrigation events, and pH not “jumping” randomly; if it does, first suspect poor soil contact or contamination rather than a true agronomic shift.
5) Data freshness, units, and the question “why an alert now?”
Mechanism: a good alert depends on fresh data and units understood by the whole team. Moisture may be reported as volumetric water content (VWC), tension (kPa), or a sensor-specific index; EC may be in mS/cm or dS/m; pH is unitless but sensitive to temperature and stable contact with the medium. What to observe: values that “freeze” or show impossible jumps can be caused by installation issues, power problems, connectivity delays, or unit misinterpretation.
Independent verification: during commissioning, adopt a simple rule—any important alert is checked in the field the same day with a control measurement (for example, a portable probe, a hand assessment of soil moisture, or a flow/pressure check). Practical decision: set thresholds from your site’s dynamics, not from universal tables: watch several full wet–dry cycles and identify when the crop shows early signs of stress or excess. Result check: after threshold adjustment, alerts should align with real decisions (start/stop irrigation, change duration, inspect filtration) rather than with “noise” between irrigation events.
6) A 7-step commissioning protocol for each zone
Mechanism: commissioning turns installation into a decision system. Without it, you get attractive graphs and random interventions. What to observe: in the first days, readings can be influenced by how you re-packed soil around the probe, trapped air, initial wetting, or incorrect orientation in the profile. Roots are also unevenly distributed; a “root-poor” spot can behave differently than the active root zone you intend to monitor.
Practical workflow: (1) document the point (zone, row, distance from emitter, depth); (2) apply a controlled initial wetting, then observe for 24 hours; (3) compare with a manual soil check; (4) run 2–3 normal irrigation cycles; (5) record irrigation start/stop so response is visible; (6) set warning thresholds (not only critical ones); (7) review after 7–10 days. Result check: if the sensor does not clearly detect irrigation events, do not set alerts yet—move the point or correct the installation.
7) Useful irrigation and fertigation alerts: from mechanism to action
Mechanism: meaningful alerts are not “low moisture” in the abstract; they are “low moisture in a zone that is drying faster than normal,” or “EC increases after each fertigation and never returns,” suggesting accumulation. What to observe: differences between zones after the same irrigation are often more informative than an absolute value at one point. A good alert has context: how fast the value changed and how long it stayed outside the chosen interval.
Independent verification: when you receive a moisture alert, check whether it matches a missed irrigation, clogging, a power interruption, or a schedule change. When you receive an EC/pH alert, verify the fertigation solution and irrigation water first (fixed-point measurement), then the substrate/soil (sample). Practical decision: change only one variable at a time (duration, frequency, sector, recipe) and track response. Result check: in the curves, the change should reduce time spent in “risk” without increasing percolation signs (persistent rise at the deeper sensor) or accumulation (EC that no longer drops between irrigations).
8) Common failure cases and how to detect them fast
Mechanism: the most expensive errors are the ones that look “plausible.” A moisture probe sitting beside an air void can read dry; a probe near a crack can read wet because of preferential flow; an EC probe in a deposit-prone spot can read constantly high salinity. What to observe: no response to irrigation, inverted response (moisture decreases when you irrigate), identical values for long periods, or sudden divergence from nearby similar zones are all red flags.
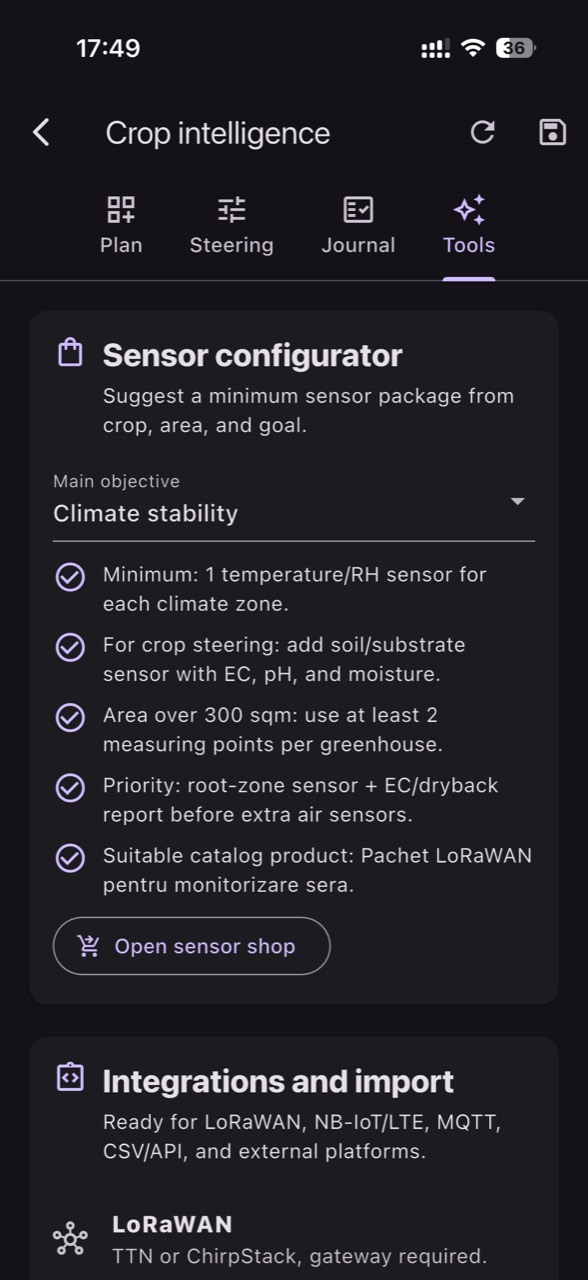
Independent verification: run a simple hypothetical test—pause irrigation in one zone for a few hours (only if agronomically acceptable) and see whether the trend changes, or apply a short irrigation and confirm the shallow probe reacts. If it does not, suspect wrong installation, poor contact, or delayed/stale data. Practical decision: keep a monthly audit routine: compare zones, check power/status, and validate 1–2 alerts with a dig or sample. Result check: the rate of “alerts with no action” should fall; if it does not, adjust zones or points rather than only tweaking thresholds. In GrowGuard, zoning and the sensor map can help you spot inconsistencies between nearby points quickly.
Conclusion
A zone strategy for soil sensors is fundamentally a strategy for asking the right questions: where does it dry first, where do salts accumulate, where does irrigation fail to reach, and where is water being lost too deep. When you choose representative points plus control points, verify independently in the field, and commission thresholds against real wet–dry dynamics, alerts become decisions rather than notifications.
If you want to turn this method into a team routine, a platform like GrowGuard can help organize zones, history, and location-based alerts—and then you validate periodically with control measurements. A short commissioning session and a review after the first weeks can move you toward irrigation and fertigation that are consistent and adapted to your own site.