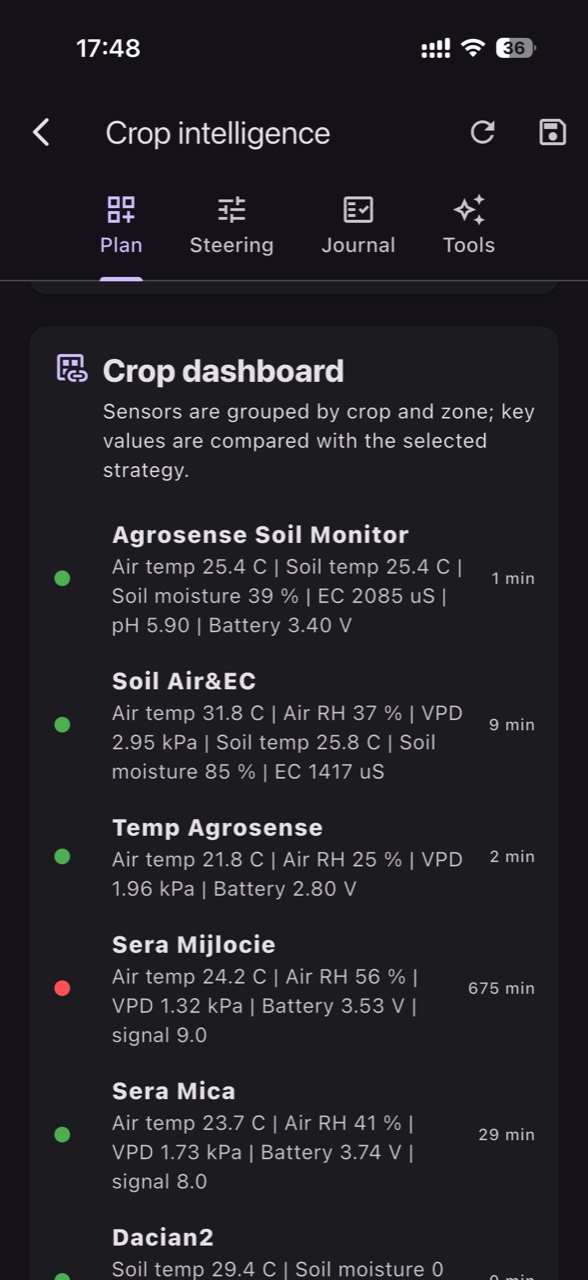
In soybeans, an irrigation decision made “from the average” can miss the exact areas that enter stress first: sandier ridges, headlands with compaction, or sections with a shallow topsoil layer. Soil sensors help, but only if they are installed in representative points and interpreted with microclimate and growth stage in mind.
The common problem is not lack of data, but treating readings as absolute truth. A sensor mounted in a wetter “pocket,” in a wheel track, near a drain, or in a different soil texture can report comfort while the crop suffers 200 meters away. On top of that, soil temperatures differ by exposure and they influence water use.
This guide is built as a diagnostic protocol. For each typical situation it explains the mechanism, what you observe in the crop, what you verify independently of the sensor, a practical decision you can make, and how you confirm afterward that the decision worked. The examples are hypothetical and must be adapted to your soil type, irrigation system, and field history.
1) Start with what a soil sensor can (and cannot) tell you
Soil-moisture sensors measure a root-zone property at the exact point where they are installed. If the sensor reads “drier,” that may reflect real crop uptake, but it can also reflect lateral flow away from the probe, poor soil–probe contact, or an installation that is too shallow. Soil temperature helps interpretation: cooler soil slows development and evapotranspiration, so two microclimates can “consume” differently even at the same measured moisture.
What to observe: midday leaf uniformity, evening recovery, differences in plant height, or how quickly rows close. What to verify independently: a quick spade check at the depth of active roots, looking for a dry/wet boundary, surface crusting, or compaction. Practical decision: don’t irrigate just because “the graph is dropping” until crop condition agrees. Result check: after irrigation, the curve should rise realistically, and in-field you should see restored turgor and wetting at the target depth—not only a damp surface.
2) Field zoning: choosing “representative” points and risk points
In field crops, the same block often contains two or three functional “soils”: lighter-textured ridges, low areas with higher water holding, and zones with different topsoil depth. Minimal zoning can start from soil maps, past yield patterns, NDVI imagery (if available), and scouting notes: where it wilts first, where water ponds, where traffic always struggles. The goal is not perfection; it’s avoiding one favorable corner standing in for the whole field.
What to observe: recurring stress patches, differences after short rains, or “bands” aligned with tillage/traffic. What to verify: compare texture with a simple hand-feel test and check the depth where you hit a denser layer. Practical decision: install at least one “representative” point and one “risk” point (the area that enters stress first). Result check: during heat, the risk zone should show faster moisture decline and often higher soil temperatures; if not, you likely chose the wrong point or depth. In GrowGuard, map-based interpretation helps when you need to see exactly which zone is signaling first.
3) Physical placement: depth, orientation, and installation errors that falsify readings
In soybeans, roots explore vertically and laterally, but the most active uptake zone shifts as the crop grows and soils warm. Good installation targets active roots, not necessarily the deepest possible layer. A sensor placed too close to the surface can overreact to small showers and evaporation; one placed too deep may “prove” water exists while the upper layer is dry and the plant cannot access deeper reserves efficiently—especially if roots are restricted above.
What to observe: charts with large “saw teeth” after dew or small rains, or nearly constant values for weeks. What to verify: dig beside the point and inspect soil–probe contact (no air gaps), cable traces, and any sign of water moving down along the access hole (a “pipe effect”). Practical decision: reinstall if you doubt the installation, ideally into the undisturbed sidewall of a pit, inserting the probe into the wall rather than into loosened backfill. Result check: after reinstallation, the response to irrigation/rain should be gradual and plausible, and different depths should show infiltration over time—not simultaneous jumps.
4) Compare microclimates correctly: exposure, wind, edges, and soil-temperature effects
Microclimate changes water demand: a windy field edge or a south-facing slope can use more water than the center of the block, even with identical soil. Soil temperature amplifies this: warmer soil accelerates root activity and evapotranspiration. A common trap is assuming equal moisture means equal plant comfort. Two points may read similarly while the crop behaves differently because of temperature, soil structure, or plant density differences that change shading and surface evaporation.
What to observe: stronger wilting at the pivot end, along roads, or near shelterbelts (where competition and shade can alternate). What to verify: measure soil temperature at the same times of day and pair it with a visual assessment of ground cover (mulch/residue, row closure). Practical decision: don’t “align” irrigation to the best-looking zone; use zone differences to set zone-specific alerts rather than a single threshold. Result check: after irrigation, the higher-demand zone should improve temporarily but then decline faster; if it doesn’t, suspect non-uniform water distribution or an infiltration limitation.
5) Misleading readings: when the sensor says dry but the cause is different
A fast moisture drop can be real (high crop demand), but it can also be an artifact: poor contact, cracked soil breaking the probe’s continuity, or a probe sitting in an unusually root-dense micro-spot compared with the rest of the zone. In soybeans, heat stress and water deficit can overlap in appearance: at midday leaves may look “drooped” even when soil moisture isn’t yet critical, especially under high radiation and wind.
What to observe: symptoms that peak at midday and disappear fully by evening, with little difference between zones. What to verify: compare the reading with a manual moisture check and a control point (a temporary second sensor or a second location). Practical decision: before increasing total irrigation, verify whether the existing irrigation is reaching the intended depth—your fix may be a longer set rather than more frequent events. Result check: if the crop looks better after adjustment but the sensor remains unusually “nervy,” the sensor may be in an atypically active micro-location; reposition it to a more representative point.
6) When the sensor says wet but soybeans show stress: compaction, hydrophobicity, and limited roots
In soybeans, soil can be “wet” by volume while water is not quickly available because of compaction, stratification, or poor aeration. In compacted areas, roots stay shallow; a deeper sensor can indicate water while the plant cannot use it. Conversely, after prolonged drying a surface layer can become water-repellent, and irrigation/rain may bypass the root zone via cracks and preferential flow, wetting unevenly despite apparently adequate totals.
What to observe: persistent wilting and weak growth in the same bands (traffic lanes), even though the sensor does not indicate a severe deficit. What to verify: a soil profile pit to identify dense layers, roots bending sideways, anaerobic smell, or temporary ponding. Practical decision: adjust tactics—avoid creating ponding in lows; consider shorter, repeated irrigations to improve wetting of the active layer; longer-term, manage traffic and tillage to reduce compaction. Result check: after changing the regime, watch whether the wetting depth becomes more uniform and whether that zone reduces its temperature and visual stress contrast relative to the rest of the field.
7) Equipment diagnosis: separating irrigation problems from sensor problems
Non-uniform irrigation often appears as “islands” of moisture that do not match topography or soil zones. In a hypothetical example, a sensor in zone A rises after irrigation while zone B doesn’t: it could be a sector receiving no water, low pressure, a partially clogged nozzle, or a programming error. Likewise, a sensor can show “frozen” flat lines because of power or connectivity issues rather than stable soil conditions—especially if the last transmission is old.
What to observe: no response after an irrigation event, or identical same-time jumps at all depths (often suspicious). What to verify: physical checks of distribution where possible (visual coverage, pressure/flow checks), plus device status checks (battery, signal, last successful transmissions). In GrowGuard, status alerts and history help you confirm whether data are fresh or interrupted. Practical decision: test the equipment hypothesis first because it is usually fastest to confirm, then adjust irrigation strategy. Result check: after fixing the issue, the sensor should respond coherently and differences between zones should again match what soil and topography predict.
8) Commissioning and thresholds: avoiding “false alarms” and validating seasonally
Commissioning means proving that the sensor measures what you think it measures, in the correct medium, with appropriate units and reporting intervals. Choose a reading frequency that captures key events (irrigation, rain, heat) without confusing noise for trend. In the first weeks, don’t rush strict thresholds; first build a local baseline by observing what curves look like when the crop is clearly comfortable versus when early stress signs appear.
What to observe: when the first stress signs appear in risk zones and what soil moisture was doing 24–48 hours before. What to verify: after each rain/irrigation, confirm in the field the wetting depth and whether soil temperature explains differences in drawdown. Practical decision: make thresholds specific to zone and growth stage; during high-demand periods, track rate of decline, not only the instantaneous value. Result check: at the next event, alerts should flag the zone that enters stress first but should not trigger when the crop fully recovers in the evening; if they do, adjust thresholds or sensor position.
Conclusion
Soil sensors are a diagnostic tool, not an oracle. In soybeans, a correct irrigation decision comes from triangulation: zone-based data, crop observation, and physical verification in the soil profile. When readings and plant behavior disagree, don’t assume one “lies”; look for the mechanism—microclimate, depth, compaction, water distribution, or installation error.
If you want to track zone differences and compare microclimates on the same map, GrowGuard can centralize sensors and history so you can quickly validate what happened after each irrigation and adjust measurement points. Consider using it as a disciplined logbook for decisions rather than a substitute for field checks.