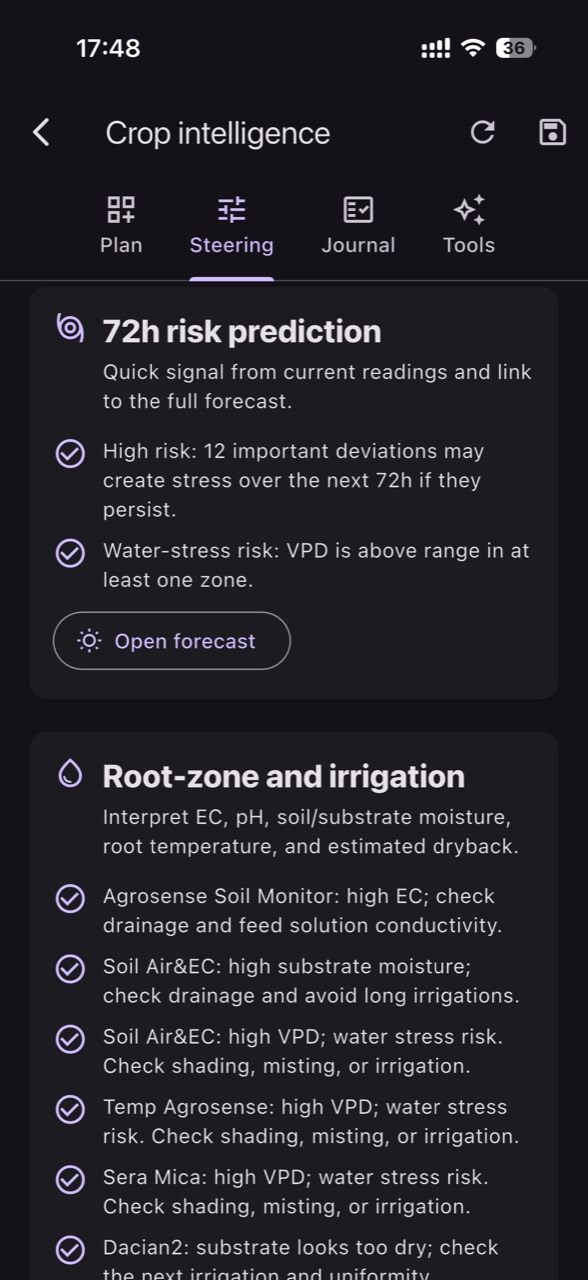
Strawberries grown in substrate have one major advantage: you can control water and nutrition more precisely than in soil. The downside is that the root system lives in a small volume, where mistakes amplify quickly. Excess water raises disease risk and soft fruit issues, while deficit reduces fruit size and can limit nutrient uptake.
pH and EC are often treated as “target numbers,” but in practice they are different indicators measured in different media: water, fertigation solution, substrate extract, or drain. A sensor shows dynamics, not full composition. A laboratory analysis tells you what you have, but not when it changed.
The key is to connect three things: (1) trends from sensors in the active root zone, (2) how you apply irrigation pulses, and (3) independent verification (manual measurements and analyses). This prevents abrupt adjustments based on isolated readings and helps you build alerts that flag real drift rather than measurement noise.
1) What you are actually measuring: moisture, pH and EC in different media
Moisture in substrate describes how much water is available to roots and how much air remains between particles. Dielectric/capacitive moisture sensors respond quickly to pulses, but they must be interpreted as a local trend: one pot or bag can be wetter than another. In strawberries, uniformity matters because sharp alternations drive stress and variability in fruit firmness and sizing.
pH and EC are a different category: they are not “plant properties,” but properties of the solution being measured. EC indicates total dissolved salts without telling you which nutrient dominates, and pH influences nutrient availability and lockout risk. Most importantly, EC of the fertigation solution is not the same as EC of drain or EC from a substrate extract; only compare values from the same sample type and the same method.
2) Sensor choice and the commissioning problem: read the root zone, not the corner of the bag
For substrate you need dedicated moisture sensors and, separately, dedicated pH/EC instruments (probes or measurements on samples). An air temperature or air humidity sensor cannot measure pH/EC, and a substrate moisture sensor does not directly report salinity. In practice, the most common cause of wrong decisions is not a “bad sensor,” but poor placement: too close to a dripper, too close to the edge, too shallow, or in a spot with few active roots.
Commissioning means proving the sensor sees what you care about. Place the probe in the active root zone at the depth where most fine roots are expected, and compare edge rows with central zones (ventilation and evaporation may differ). Verify independently: after a pulse, moisture should rise quickly, then fall gradually. If the signal stays “stuck” or shows jumps unrelated to irrigation, suspect poor contact with substrate, wiring issues, or unsuitable positioning.
3) How to read irrigation pulses: response, drain, recovery
In substrate, effective irrigation looks like a sequence of pulses that recharge the root zone without drowning it. On a chart, look for three stages: an immediate rise after a pulse (infiltration), a short plateau/lag (redistribution), and a gradual decline (crop uptake plus evaporation). If the rise is large but the decline is very slow, you may be keeping too much water and limiting aeration; if the rise barely appears, either the pulse is insufficient or the probe is not in the truly wetted zone.
Independent verification can be done with a simple hypothetical routine: collect drain from a representative point after a few pulses and note approximate volume plus EC/pH measured with a calibrated handheld meter. The practical decision is not “change the whole program,” but refine the question: is it a distribution issue (drip function, flow, uniformity), a volume-per-pulse issue, or a timing issue (starting too early/finishing too late)? Validate by watching whether, over the next 1–3 days, the between-pulse decline becomes stable and comparable across zones.
4) Sensor trends vs laboratory analysis: when to use each
Sensors are excellent at showing change: sudden moisture spikes, faster drying on a hot day, or gradual salt build-up suggested by rising drain EC. However, on-site pH/EC monitoring does not replace a lab when you need chemical diagnosis: water alkalinity, differences between water sources, or interpretation of a persistent nutrition problem. Also, “water,” “fertigation solution,” “substrate extract,” and “bulk soil/substrate EC” are different measurements; lab work helps prevent mixing media and methods in one conclusion.
A useful two-step protocol is: first, use sensors to identify the timing and direction of drift (for example, drain EC rising day by day despite the same recipe). Then take a sample for analysis or run standardized field measurements to confirm the likely cause (high water alkalinity, an unsuitable recipe, insufficient drain, or a distribution blockage). Decisions should be gradual: change one factor at a time and verify the effect in trends, not in “today’s value.”
5) EC: how salts accumulate and how to catch it without false alarms
In substrate, EC usually rises through two mechanisms: concentration via evapotranspiration (the plant uses water faster than salts) and repeated fertigation without enough leaching through drain. In strawberries this can push the plant toward osmotic stress—stiffer foliage, affected leaf tips, smaller fruit, or uneven ripening—without becoming immediately obvious. But EC alone cannot tell you whether the excess comes from nitrogen, potassium, or another ion; it only says “there are many salts.”
What to observe in data: drain EC that climbs steadily while moisture appears acceptable suggests accumulation; drain EC that swings wildly after each pulse can indicate poor mixing, unstable measurement, or inconsistent drain sampling. Verify independently by calibrating the EC meter and collecting drain from the same type of container at the same interval after a pulse. A practical decision may focus on improving uniformity and drain conditions, not only “lowering concentration.” Confirm success when drain EC gradually returns to a stable level without unexplained spikes.
6) pH: why it drifts and how to link the root zone to water quality
Root-zone pH is influenced by irrigation water pH and alkalinity, fertilizer chemistry, and the plant’s own ion uptake balance. A common mistake is to watch only the fertigation tank pH and assume roots see the same value. In reality, the substrate buffers changes, and roots can shift local pH by taking up anions and cations at different rates. That is why a “perfect” reservoir pH can coexist with an unfavorable pH in drain or in a substrate extract.
What to observe: pH that drifts slowly over weeks points more to a systemic cause (water, recipe, buffering), while sharp changes after interventions suggest dosing or mixing issues. Verify independently with a water analysis that separates pH from alkalinity and from total soluble salts (EC), because these are different dimensions of water quality. The practical decision is not “correct pH at any cost,” but to establish a consistent sampling method (drain or extract) and check whether suspected symptoms truly correlate with pH drift.
7) Moisture: the water–air balance, disease pressure and fruit quality
In substrate strawberries, too much water means less air at the roots, higher risk of root stress, and greater sensitivity to soilborne pathogens. Too little water creates growth fluctuations and smaller fruit, and on bright days plants can stress even if the substrate “seems wet” at one point. A frequent trap is stratification: the top dries quickly while the bottom stays loaded, especially when drainage is limited or the container geometry encourages water to sit low.
What to observe in trends: after pulses, moisture should rise enough to remove deficit, then return to a healthy decline slope. If the baseline rises day by day with little depletion between pulses, you likely have overwatering or poor drain; if it drops abruptly between pulses, you have deficit or uneven distribution. Verify independently by checking drain function and, hypothetically, weighing a representative bag/pot to estimate water dynamics. Validate the decision by uniformity: differences between zones (edge vs center) should shrink after adjustments.
8) Useful alerts in GrowGuard: thresholds based on trends, not isolated numbers
Good alerts start with an operational question: what event do you want to catch early? In substrate strawberries, useful events include accelerated drying (stress risk), persistent over-wet conditions (root risk), slow EC drift (accumulation), and distribution anomalies between zones (large edge–center difference). Instead of universal fixed thresholds, use relative triggers and time windows: for example, moisture falling too fast within a few hours, or EC trending upward across multiple days.
In GrowGuard, alerting becomes more robust when you compare real farm zones on the same sensor map and confirm data freshness (a sensor that stopped transmitting can mimic “perfect stability”). Independent verification is mandatory before changing irrigation: confirm on site a clogged dripper, pressure issue, or a container with blocked drain. The practical decision is to fix the physical cause first, then adjust the recipe. Confirm the result in history trends: alerts should become rarer for the right reason, not because thresholds were widened.
Conclusion
Monitoring pH, EC and moisture in strawberry substrate works when you clearly separate three layers: what the sensor measures (local dynamics), what a standardized sample tells you (drain/extract), and what laboratory analysis clarifies (water chemistry and root-cause context). Instead of chasing a “perfect value,” track direction, rate of change, and zone-to-zone differences—then adjust gradually and verify the effect.
If you treat each irrigation pulse as a repeatable experiment and build alerts on verifiable trends, you reduce the risk of impulsive reactions. For teams that want to organize these zone checks and spot drift quickly, GrowGuard can centralize sensor trends and alerts; start with one well-commissioned zone and expand only after you’ve confirmed measurement correctness.