In protected strawberries, the most expensive mistake is often not missing water on a hot day, but keeping a “comfortable” moisture regime that, on cold or cloudy days, leaves foliage wet and air close to saturation. That is where condensation forms, and disease pressure rises without obvious symptoms at first.
At the same time, strawberries have a relatively shallow, sensitive root system. Large swings in root-zone moisture can lead to soft fruit, uneven sizing, and periods when the plant does not take up nutrients correctly. In substrate systems this can happen faster because the available water volume is limited and changes quickly.
A practical way to connect climate to irrigation is to watch three things in parallel: moisture in the active root zone, air humidity (and therefore VPD), and the time windows when leaves and fruit stay wet. The article below explains mechanisms, what to observe, what to verify independently, and a usable sensor commissioning workflow—without imposing a fixed irrigation template.
1) Why “uniform” at the root means quality, not just survival
Strawberries need relatively steady moisture in the active root zone to maintain a consistent flow of water and nutrients toward leaves and fruit. When substrate/soil cycles between too wet and too dry, the plant oscillates: very wet periods increase the risk of root oxygen stress and softer fruit, while dry periods slow growth and reduce fruit sizing. The goal is not maximum moisture, but predictable availability that matches plant demand and avoids extremes.
What to observe: midday wilting peaks, thicker or more rigid leaves after stress episodes, variable firmness within the same row, and differences between line ends and mid-row. What to verify independently: drip uniformity (flow variation, partial clogs), drainage behavior in substrate, and in soil the texture/compaction that can hold water. Practical decision: split irrigation into smaller pulses when evaporative demand increases. Result check: the moisture curve becomes flatter and row-to-row variability decreases.
2) Air humidity, wet leaves, and how Botrytis risk is created
In protected crops, Botrytis and other foliar/fruit rots are strongly linked to leaf wetness duration and long periods of high relative humidity, when evaporation from surfaces slows. Condensation forms when surfaces (leaves, plastic film, metal parts) drop below the dew point; you do not need rain to have “water” on the plant. Flowers and ripening fruit are especially vulnerable to this microclimate because delicate tissues remain wet longer.
What to observe: a “closed” smell in the morning, droplets on inner plastic, persistent damp patches inside the canopy, and denser zones where air stagnates. What to verify independently: inoculum sources (plant debris, planting material, irrigation water) and hygiene, because microclimate readings indicate conducive conditions, not pathogen presence or a diagnosis. Practical decision: prioritize early-morning ventilation and/or gentle heating around sunrise to move quickly above dew point. Result check: less time with visible condensation and a steadier humidity profile without harsh temperature swings.
3) VPD: what it tells you—and what it does not—in strawberries
VPD (vapour pressure deficit) is an indicator of how strongly the air can pull water through transpiration. It is calculated from air temperature and relative humidity, so it is an estimate of evaporative demand. In strawberries, very low VPD means near-saturated air: leaves dry slowly, and flower function and general crop “activity” can suffer. Very high VPD means strong demand and higher water-stress risk, especially in substrate where buffering is limited.
What to observe: at low VPD, mornings with wet leaves and “lazy” plants; at high VPD, wilting and edge scorch if water and nutrition do not keep up. What to verify independently: leaf temperature can differ from air temperature (often cooler at night and warmer in sun), so leaf-level VPD may not match the air-based estimate. Practical decision: use VPD as a signal to synchronize ventilation and irrigation pulses, not as a universal setpoint. Result check: wet-leaf episodes shorten without increasing midday wilting.
4) Sensor choice: media, units, data freshness, and common traps
A workable workflow needs measurements from different media: soil/substrate moisture, air temperature and air humidity (to calculate VPD), plus pH/EC in the fertigation solution and/or in drain or extraction, depending on the system. A temperature sensor does not measure pH or EC; those require dedicated probes. Likewise, EC measured in the nutrient solution is not the same as EC in drain or in a substrate/soil extract—each represents a different medium and must be interpreted accordingly.
What to observe: slow reporting intervals can miss short VPD spikes or rapid moisture drops; fresher data shows immediate response to a ventilation event or irrigation cycle. What to verify independently: units (percent, kPa, mS/cm), the sampling moment for pH/EC, and the method (irrigation water vs in-line solution vs drain). Practical decision: choose a transmission interval that matches how fast your system changes (more frequent during unstable weather). Result check: you can clearly correlate an event (venting/irrigation) with curve movement, not only with daily averages.
5) Correct placement: active root zone and edge-versus-centre differences
In strawberries, moisture-probe placement can be the difference between improving control and worsening the problem. In substrate (bags, pots, gutters), place the probe in the volume actually explored by roots—neither pressed against the dripper nor in the thin layer that dries immediately. In soil, placement must match real rooting depth and layering; colder or more compacted bands can hold water and distort what the plant experiences.
What to observe: edge rows often have higher evaporation and different airflow; the centre can retain humidity and heat, increasing condensation risk. Compare zones: edge versus centre, tunnel end versus middle, near doors versus deep inside. What to verify independently: inspect roots at a check point and compare with the sensor “story” (high moisture reading but sparse roots suggests wrong placement). Practical decision: duplicate measurement points in contrasting zones before changing management. Result check: differences become explainable and stable rather than chaotic.
6) Commissioning: calibrating interpretation without “resetting” the crop
Commissioning is not just seeing numbers—it is proving the signals make agronomic sense. A practical protocol: (1) record soil/substrate type, irrigation method, and probe positions; (2) run a controlled irrigation cycle and watch the immediate moisture response; (3) pause irrigation long enough to see the natural decline; (4) correlate with air temperature/RH and ventilation openings. If the curve does not react, suspect installation or measurement issues before changing crop strategy.
What to observe: in substrate, moisture should rise quickly after irrigation and then fall gradually; in soil, the response may be slower and more buffered. What to verify independently: physically check moisture (a manual sample), confirm the dripper wets the probe zone, and rule out water bypassing down the side of the substrate container. Practical decision: reposition the probe before changing the irrigation recipe. Result check: after repositioning, the response to irrigation becomes coherent and repeatable across similar events.
7) Daily workflow: tying irrigation to VPD and risk without identical recipes in any weather
The classic protected-crop mistake is keeping the same irrigation “recipe” on cold, hot, and cloudy days even though crop water use changes sharply. A useful workflow starts with questions, not minutes: “How fast does moisture drop between irrigations?”, “When do I enter long low-VPD periods with wet-leaf risk?”, “Which zones stay wetter?”. On cloudy days, reducing frequency can matter more than the total daily volume, because drying power is limited.
What to observe: if VPD stays low for many hours, any irrigation that wets the canopy (splashing, leaks, runoff) will prolong wetness. If VPD rises abruptly, irrigating too late can produce stress and smaller fruit. What to verify independently: confirm ventilation starts early enough, and check for water losses onto leaves from micro-leaks or fittings. Practical decision: shift part of irrigation earlier on sunny days and hold back longer on cold days. Result check: compare moisture curves and time-at-high-RH before/after the change using the same zone and similar weather windows.
8) pH/EC and water: measurement differences, lab confirmation, and disease-linked impacts
In strawberries, salinity stress or pH imbalance can reduce vigour and predispose plants to quality issues, but only if the tools are used correctly. Water quality assessment separates pH from alkalinity and from soluble salts (EC). On-site pH/EC monitoring complements laboratory analysis; it does not replace it. Critically, EC in source water, in fertigation solution, and in drain are different measurements in different media, and they are not directly comparable without context and a consistent method.
What to observe: in a hypothetical scenario where drain EC trends upward while moisture stays high, you can end up “wet but salty,” which can limit uptake. If solution pH fluctuates, nutrient availability shifts and symptoms become hard to interpret. What to verify independently: periodic standardized sampling and lab checks, especially for water alkalinity and for substrate/soil extracts. Practical decision: adjust leaching/drain strategy and mixing uniformity checks rather than simply “adding more water.” Result check: EC trends stabilize and the crop response becomes more uniform instead of alternating between flushes and stalls.
Conclusion
In protected strawberry production, moisture control is not a single lever but a synchronization of root zone, air, and surfaces: keep enough, uniform water where roots actively feed, avoid long wet-leaf windows, and use VPD as an indicator of evaporative demand. The key is verification: compare zones, confirm with inspections, and record the effect of each change within 24–48 hours rather than relying on assumptions.
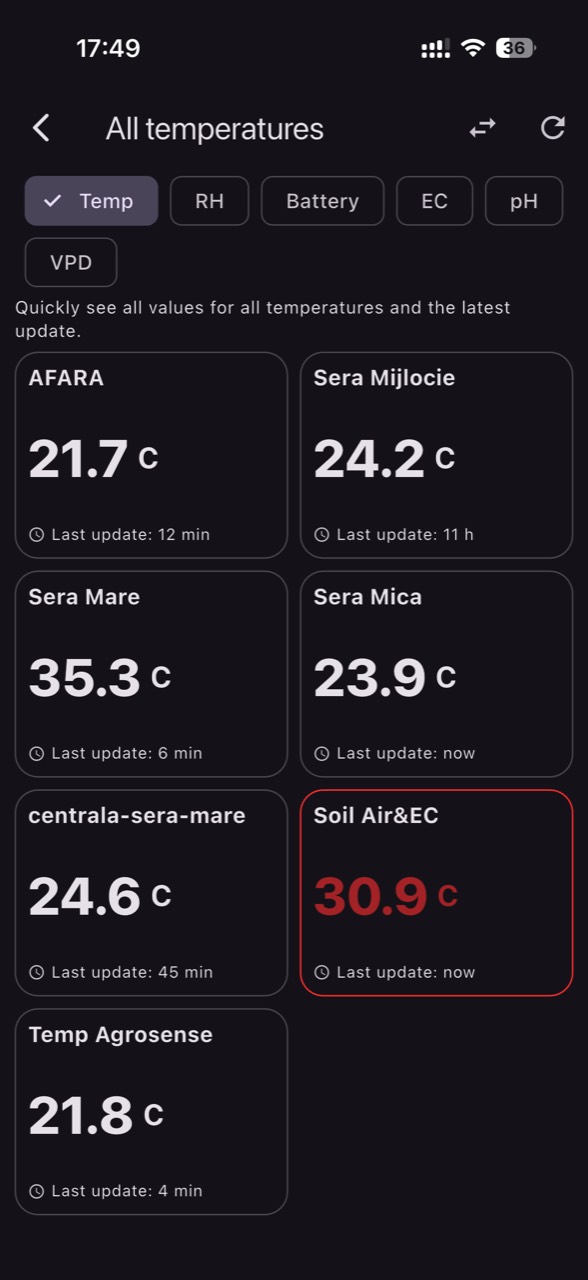
If you want to commission a monitoring system quickly, start with a small number of well-placed sensors and validate responses to irrigation and ventilation before setting thresholds. In GrowGuard you can follow live moisture, temperature, RH and VPD by zone and set alerts to highlight critical episodes; then verify in the crop that the intervention actually shortened condensation and stabilized root-zone moisture. For a site-specific commissioning plan, ask for a technical discussion with your integrator or team.