In sunflower, water stress often shows up late: the plant can regulate transpiration, and leaves may look acceptable until losses are already underway. That’s why soil and microclimate sensors help—but only if you place them in meaningful zones and understand when an “alarming” value is actually an artifact of installation or field conditions.
The most common mistake is not choosing the wrong protocol (NB‑IoT vs LoRaWAN), but choosing the wrong point. A sensor installed in a compacted strip, on a knoll, or near a wheel track can report “drought” even when most of the field still has available water. Likewise, an air-temperature sensor at the crop edge may describe the road’s microclimate, not the canopy’s.
This article is a diagnostic guide: how to separate a real crop issue from a misleading reading, how to compare microclimates between zones, and what independent checks to do before decisions. The examples are hypothetical and follow a protocol: understand the mechanism, verify in the field, take a practical action, then confirm the result in the data.
1) What “drought” means in sunflower: the soil reservoir and plant rhythm
Sunflower can develop a root system that explores deep, but water availability still depends on soil texture, structure, and compaction. In heavier soils, water may be present yet difficult to access because poor aeration limits root function; in lighter soils, water can disappear quickly through drainage. So a “low moisture” number at a single depth does not automatically equal stress. The real mechanism is the balance between root extraction and replenishment from rain or irrigation.
What to observe: midday wilting versus recovery by morning, leaf orientation or partial closure, unevenness along rows, and early shifts toward small or prematurely inclined heads. What to verify independently: dig a profile with a spade, do a simple infiltration check (pour water and time it), and, if possible, take a soil sample to confirm layering or compaction. Practical decision: interpret by zones (not one field average) and set local thresholds, then confirm over the next days whether trends—not spikes—track plant condition.
2) Define crop zones before installation: elevation, texture, and traffic
Before you put any sensor in the ground, map the zones that can truly hold different microclimates: slope versus flat areas, wind-exposed edges, headlands with traffic, texture changes (sand to loam or clay), patches with heavy residue, or places with a history of ponding. Mechanism: the same rainfall produces different profile recharge, and the same air temperature produces different evapotranspiration depending on wind and radiation.
What to observe: prior yield history (if you have it), differences in color and vigor, wheel tracks and surface sealing, and crust formation. What to verify independently: two or three control pits per zone (profile, roots, structure), plus a manual check of soil surface temperature at midday across zones. Practical decision: place at least one “average reference” point and one “risk” point (the area that dries first). Check the result: zone differences should be stable through time, not random from one day to the next.
3) Soil sensor placement: depth, contact, and avoiding “lying points”
For sunflower, a soil-moisture sensor should represent the active root zone, not just a surface layer that dries after one windy day. In practice, multiple depths or a profile set can be used, but even with a single point you must avoid traps: too close to the row versus between rows, next to an atypical plant, in soil loosened by the auger, or with poor contact and air gaps. Mechanism of the error: many sensors infer moisture from the soil’s dielectric response, which is strongly affected by air and disturbed soil structure.
What to observe in data: abrupt jumps right after installation, “too perfect” values that barely move, or overreaction to a small rainfall. What to verify independently: pull the sensor and inspect its imprint (soil should adhere uniformly), re-drill with the correct diameter, and gently pack back in layers. At least once per season, compare against a simple hypothetical gravimetric check (weigh wet soil, dry it, weigh again) to anchor interpretation. Practical decision: reposition the point or add a nearby reference point. Confirm success: the curve becomes coherent with weather events and field observations.
4) The microclimate that misleads: temperature, humidity, and exposure effects
In open field conditions, microclimate is driven by radiation, wind, and local shading. An air sensor placed too low may “feel” heat radiated from soil; placed too high or on an edge, it may measure wind-mixed air that differs from the canopy layer. For diagnosis, it matters to remember that VPD calculated from air temperature and relative humidity is an estimate; leaf temperature can be higher in heat and lower in wind, changing real transpiration demand.
What to observe: at midday, an unshielded sensor can report exaggerated temperatures; after a rain, relative humidity can look high while deeper soil still trends toward deficit. What to verify independently: correct shielding and placement within the crop, plus comparison to a nearby weather station as a trend reference only. Practical decision: use microclimate data mainly to explain differences between zones (for example, a wind-exposed margin versus the center). Check the result: if moving the sensor changes the absolute level dramatically but not the overall trend shape, the original position was likely incorrect.
5) NB‑IoT vs LoRaWAN in the field: when “missing data” looks like drought
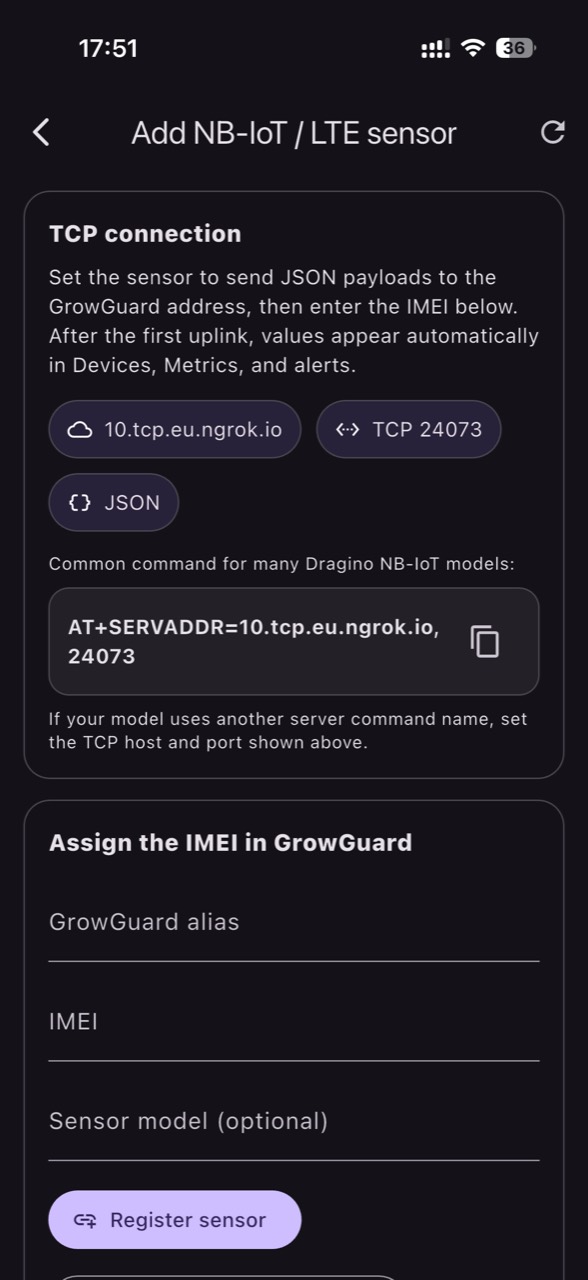
Sparse or delayed readings can create a false story: it looks like moisture “keeps falling,” but you actually have transmission gaps. NB‑IoT is cellular, so it depends on coverage, operator support, and power-saving configuration; you don’t need a private LoRaWAN gateway, but you do need a stable signal and a subscription. LoRaWAN depends on a radio link to a gateway and a network/application server; data can then be forwarded via integrations (for example over MQTT), and MQTT is an application messaging protocol—not an alternative form of radio coverage.
What to observe: hours without packets, misaligned timestamps, or “stuck” values that repeat. What to verify independently: check device-reported battery and signal status, review whether the measurement interval is regular, and confirm units are interpreted correctly (percent versus volumetric content, kPa, etc., depending on sensor type). Practical decision: before drawing agronomic conclusions, treat it as a telecom incident—relocate the antenna/device, slightly raise the mounting point, or check the gateway side. Confirm the fix: after remediation, data becomes continuous and weather events show up as coherent changes rather than discontinuities.
6) Commissioning: quick checks that separate installation error from real field change
A short commissioning protocol prevents “false alarms” all summer. On installation day, record the exact location (zone), depth, position relative to the row, soil type, and take a photo of the profile. Then run two simple tests: a local wetting test (a small amount of water applied near the point, if feasible) and a drying test (observe the decline over the next 24–48 hours). Mechanism: the sensor must respond to controlled change; otherwise it is not anchored to field reality.
What to observe: if the sensor doesn’t move at all after local wetting, either the contact is poor, the depth/point is outside the wetted volume, or the units are being misinterpreted. What to verify independently: check probe integrity and cabling (if present), repeat the test 10–20 cm to the side, and compare with a manual soil check by feel (texture and moisture) in the same layer. Practical decision: correct the installation immediately rather than postponing it “until problems appear.” Confirm: in subsequent rains, the sensor response should show a repeatable signature (faster change near the surface, slower at depth if you measure a profile).
7) Differential diagnosis: real drought vs compaction, weeds, disease, or irrigation faults
When a zone looks “dry” in the data, list alternative causes. Real drought typically produces a progressive deficit through the profile and only partial recovery after a small rainfall. Compaction can look like chronic deficit because roots cannot exploit the soil uniformly; you may see surface wetness yet poor accessible water where roots actually function. Weed pressure increases water use and can create sharp local declines. In irrigated fields, a sector fault can mimic drought, but the signature is “no response” after an irrigation event that should have changed the curve.
What to observe: spatial patterns (only headlands, only near a road), row-side asymmetry, or large differences between two nearby points. What to verify independently: dig to inspect roots (density and branching), look for a compacted layer, check irrigation uniformity (if applicable), and scout for non-water symptoms (lesions, pests, mechanical damage). Practical decision: choose the smallest action that tests the hypothesis—for example, a focused irrigation-sector check, or planning a localized decompaction strategy for next season. Check the result: look for a change in trend direction or responsiveness, not a single “magic” number.
8) Comparing microclimates: building a control zone and confirming decision impact
Good comparison is not placing two sensors at random and declaring one area “better.” You need a control zone that is representative and stable, plus one or two risk zones. Then compare relative differences: how fast moisture drops after a windy day, how quickly it rebounds after rain, and how air temperature aligns with soil drying between zones. Mechanism: microclimate amplifies or reduces evapotranspiration demand, while the soil profile filters and delays the response.
What to observe: if the risk zone consistently runs slightly warmer and drier, and plants visually confirm it, you likely have a real, repeatable microclimate effect. What to verify independently: temporarily swap a sensor between zones (hypothetically for 48 hours); if the difference “follows the sensor,” you have a placement issue, but if it stays with the zone, it’s a field phenomenon. Practical decision: treat zones separately in interpretation and alerts; in GrowGuard you can track readings by map and crop zone without blending distinct areas into one average. Confirm: after rainfall, zones should converge in level but keep their characteristic drying-speed difference.
Conclusion
A good monitoring setup in sunflower is not the one that merely “shows drought,” but the one that helps you prove whether drought is real, where it starts first, and what explains it—soil, microclimate, installation, or connectivity. The key is diagnostic discipline: clear zones, correct placement, commissioning with simple tests, and independent checks in the soil profile.
If you want to turn microclimate comparisons into a consistent team routine, a platform like GrowGuard can help with zone-based visualization, sensor-status alerts, and history—without replacing field verification. Invite your team to use the same protocol: hypothesis, verification, decision, and confirmation in the data.