Sunflower is often described as “drought tolerant”, yet yield and head filling can still be sensitive to water stress in short windows—especially when evaporation demand rises quickly. In open fields, soil differences, compaction, and topography create zones that enter deficit days earlier than the rest of the plot. Without measurement, symptoms show late and unevenly.
Drought monitoring is not just “a moisture sensor”. It means knowing what you measure (water content or tension), at what depth, how fresh the data is, and whether the sensor reads realistically for your soil type. In field crops, weak commissioning leads to false alarms—or worse, a false sense of security that delays a needed intervention.
This article explains the technical fundamentals and a usable commissioning workflow for sunflower: choosing sensors and connectivity, installing across the soil profile, doing independent checks, and applying data quality criteria. The goal is to make a practical decision (irrigation, adjusting field operations, scouting) and then verify—using both data and field observations—whether the intervention had the intended effect.
1) Why sunflower can “look fine” before yield is lost
Sunflower can maintain turgor and short-term activity through exploratory rooting and stomatal regulation, but that does not mean stress is absent. When atmospheric demand increases (wind, temperature, low relative humidity), the plant may reduce transpiration, lowering photosynthesis in key periods for formation and filling. In practice, two zones with similar visual appearance can hold very different reserves in the soil profile.
What to observe: slowed growth, slightly angled leaves, color differences on ridges or at field ends. What to verify independently: a field auger/pedology check to see where the dry layer starts, plus compaction assessment that can restrict roots. Practical decision (hypothetical): if a ridge zone reaches deficit first, you prioritize irrigation by sector or adjust the sequence of operations. Check the result by watching moisture response at depth and whether growth rate becomes more uniform in the following days.
2) Which parameters matter for drought and the root zone
For drought, two measurement families dominate: volumetric water content (often reported as a fraction or %) and soil water tension (kPa), which describes how hard the plant must work to extract water. In addition, soil temperature influences uptake and water dynamics, while electrical conductivity (EC) of the soil solution/substrate indicates total salinity—not individual nutrients. Important: interpret EC in its measurement method/medium; EC in an extracted solution differs from “apparent” bulk EC.
What to observe: trends rather than isolated numbers; daily drawdown slopes and the speed of recharge after rain/irrigation. What to verify independently: a lab soil test for texture and salinity if you suspect issues, and a spot check with a handheld instrument to confirm trend direction. Practical decision (hypothetical): if moisture appears “high” but tension rises, you may have poor drainage or a mismatched sensor—so you adjust interpretation before ordering water. Check the result by looking for consistency across parameters and field evidence (infiltration, crusting, ponding).
3) Sensor selection: what to demand from equipment, not from “promises”
In sunflower, a robust minimum set is: a moisture sensor across the profile (ideally multi-depth or multiple points) plus soil temperature; optionally EC if you irrigate/fertigate and want salinity control in the active zone. Do not confuse sensors: a temperature sensor cannot measure EC/pH. EC and pH require dedicated probes, and soil pH is sensitive to method and maintenance. Define from the start the units you will use and the reporting interval you expect.
What to look for in specifications: long-term stability (drift), suitability for heavy vs sandy soils, requirements for good soil contact, and calibration needs. What to verify independently: a common-sense two-point check (dry soil vs saturated soil) or a side-by-side comparison of two sensors at the same spot to identify outliers. Practical decision (hypothetical): if soils vary strongly, you may prefer more simple sensors across zones instead of one “perfect” sensor in the wrong location. Check the result through fewer unexplained differences between zones and fewer, more relevant alerts.
4) Field connectivity: NB-IoT vs LoRaWAN and what “fresh data” means
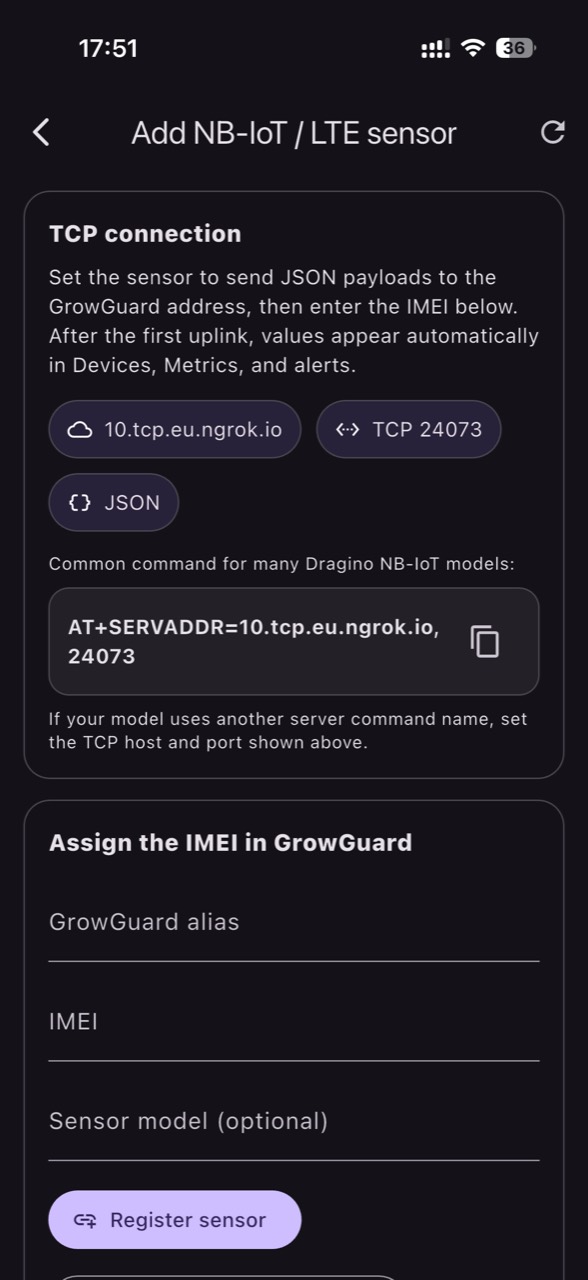
NB-IoT is cellular: deployment depends on coverage, operator-supported bands, a subscription, and power-saving settings; you do not need a private LoRaWAN gateway for NB-IoT. LoRaWAN is narrowband radio in unlicensed spectrum and requires a gateway plus a network/application server; application data can then be forwarded via protocols such as MQTT, which is application-layer messaging—not “coverage”. In both cases, plan transmission frequency and delay tolerance before installation.
What to observe: latency (minutes vs hours), packet loss, data gaps, and whether they correlate with weather or position (ridges, tree lines, embankments). What to verify independently: a log of signal/network indicators if the device reports them, and a field test before permanently burying the installation. Practical decision (hypothetical): if you need fast reaction to an event (e.g., irrigation after a threshold), report more frequently and accept higher energy use; if you only need weekly water balance, optimize for autonomy. Check the result by auditing your “data window”: how many valid points arrive per day and whether gaps match reality or the network.
5) Designing by zones: how many points, and where they matter in sunflower
In open fields, “one point” rarely represents an entire plot. In sunflower, critical zones are those that lose water first: ridges, sandier textures, headlands where machinery turns (compaction), areas with different residue cover, or slope positions receiving runoff. Design zones before buying sensors: split the field by soil, relief, and yield history. Then allocate at least one reference point per zone that drives a real decision.
What to observe: differences that persist across weeks, not just immediately after a rain. What to verify independently: a transect using an auger/spade to compare moisture at the same depth, plus geolocated photos (hypothetical) of crop uniformity. Practical decision: if the “weak” zone shows earlier deficit, treat it as a separate zone for interpretation and alerts—not as a “sensor error”. Check the result by convergence of trends after an intervention and fewer surprise stress events during heat spells.
6) Profile installation: depths, soil contact, and mistakes that ruin data
For sunflower, you want to see dynamics in at least two layers: a shallow layer (fast response to rain and evaporation) and a deeper layer (the reserve that sustains the crop between events). Exact depths must be adapted to your soil and the actual—not assumed—rooting profile. Installation requires tight sensor–soil contact without air gaps; in heavy soils, a poorly closed slit can create preferential flow and “inflate” readings after rain.
What to observe after installation: instant “perfect” responses to every rain can mean water running along the sensor path, not wetting the soil matrix. What to verify independently: check density/compaction next to the sensor and inspect any cable route (if present) to avoid channeling water. Practical decision (hypothetical): if you suspect hydraulic short-circuiting near the sensor, reinstall and mark the point as “not valid” until trends normalize. Check the result via a slower, more realistic response to precipitation and better alignment with field infiltration observations.
7) Commissioning: rain/irrigation test, unit verification, and data audit
Commissioning is not finished when “a value appears on the platform”. Run a controlled test: before and after a wetting event (rain or irrigation), confirm the shallow layer responds first and deeper layers follow with a plausible delay. Confirm units are as expected (%, fraction, kPa, dS/m, etc.) and that the reporting interval matches your plan. Once stable, anchor interpretation on trends and define what “stale data” means for your operation (for example, missing more than X hours).
What to observe: stuck values, impossible jumps, repeated resets, or one sensor staying flat while others move. What to verify independently: compare with a manual spot check (auger) and, if you have multiple sensors, overlay 7–14 days of trends to test consistency. Practical decision: if data fails the test, do not set agronomic alerts yet; start with status alerts (battery, missing data) and fix quality first. Check the result by fewer anomalies and high time-series availability. In GrowGuard you can follow live and historical trends and interpret them by zone for more reliable use.
8) From data to decisions: local thresholds, field verification, and error control
Instead of a “universal setpoint”, build local thresholds from 2–4 weeks of stable operation plus agronomic guidance for your hybrid, soil, and irrigation system. Start with trend alerts: rapid drawdown, lack of recharge after an event, or a large divergence between shallow and deep layers. If you also add air temperature and humidity, VPD computed from those is an estimate of atmospheric demand; leaf temperature can differ, so use VPD as context—not as a diagnosis.
What to observe: whether high-demand days (VPD/temperature/wind) coincide with faster soil dry-down. What to verify independently: field inspection at key hours (often afternoon), irrigation uniformity checks (if present), and surface condition review (crust, mulch, weeds consuming water). Practical decision (hypothetical): if one zone shows steady decline without recharge, schedule a corrective irrigation or adjust that sector, then confirm the target depth recovers—not only the surface. Check the result the next day: the curve stabilizes and zone differences shrink. GrowGuard can help keep zone-based alerts and history aligned, without confusing monitoring with automation (which remains a separate project if desired).
Conclusion
Sunflower drought monitoring becomes useful when treated as an agricultural engineering instrument: measure the right variable, install across the profile, validate using real wetting events, and continually cross-check against field reality. The physiological mechanism (stress in short windows) demands stable, fresh data—not an occasional “reading” that cannot be trusted.
If your sensors are already in place, the next step is a simple audit: units, latency, depth response, and zone-to-zone differences. Once data is clean, thresholds and alerts become a working tool rather than noise. If you want to centralize time series and zone-based alerts for team use, GrowGuard can serve as a monitoring platform for that workflow.