In greenhouse tomato production, pH, EC and VPD are indicators that can quickly explain why plants slow down, abort flowers, or produce uneven fruit. The problem is that the same indicators can also mislead you: a probe installed in an “atypical” spot, or a badly taken sample, can show a crisis that is not actually happening in the crop.
When an alert arrives, the temptation is to correct immediately: more water, more feed, more acid, or more ventilation. In tomatoes, abrupt reactions can amplify dry–wet cycling, destabilize calcium uptake, and affect quality (cracking, blossom-end rot risk, taste). That’s why the first step is diagnosis: what is happening in the root zone and what is happening in the air—by zone.
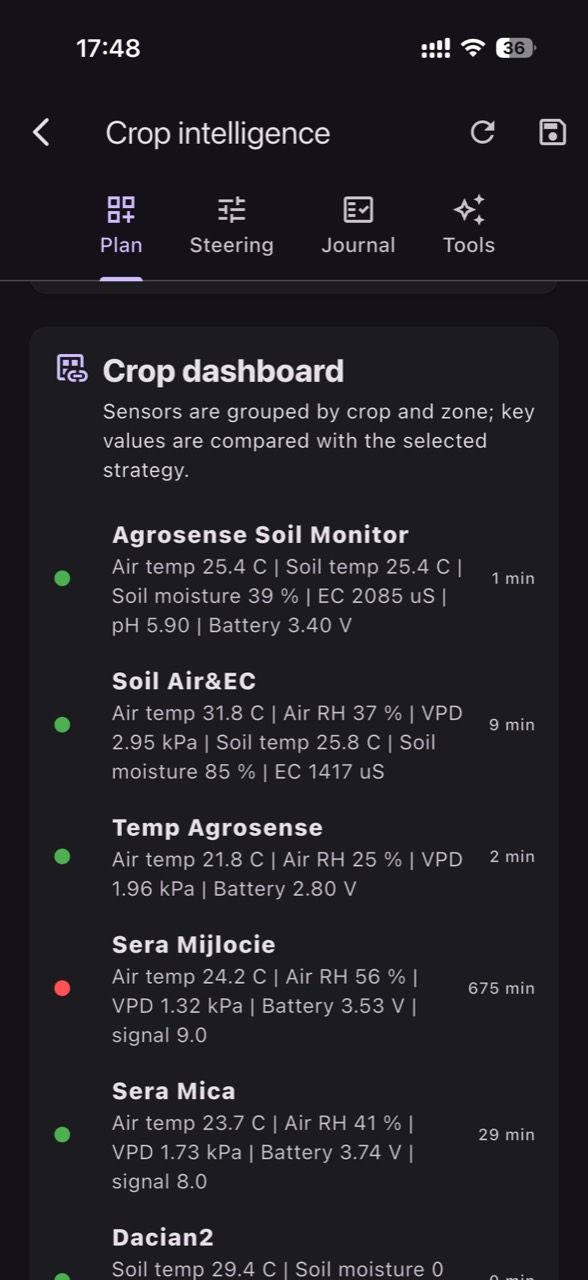
This guide is built as a differentiation protocol: real crop problem versus misleading reading (placement, method, sensor drift) versus equipment problem (drippers, filters, injectors, mixing). The focus is on sensor placement, comparing greenhouse microclimates, and independent checks that confirm or reject an alert before you intervene.
1) Know what you are measuring: pH and EC are different, and the “medium” matters
pH describes acidity, while EC (electrical conductivity) describes total dissolved salts—not “how much nitrogen” or “how much calcium” you have. Even more important: pH/EC in source water, in fertigation solution, in drain water, in a substrate extract, or in bulk soil are different measurements with different dynamics. Confusing the media leads to wrong conclusions: a high EC in drain does not automatically mean high EC right at the root tip.
What to observe: time of day, irrigation sequence, and how readings track climate. What to verify independently: confirm with a manual sample from the same medium (for example, correctly collected drain) and record units (mS/cm or dS/m, often treated similarly in practice). Practical decision: don’t change the recipe based on one point; separate “water quality” from “root-zone accumulation.” Check the result: after changes, look for a stabilized trend over 24–72 hours, not a single reading.
2) Zone-based sensor placement: why three points beat one “perfect point”
Greenhouses have stable microclimates: row ends, near doors, along cold walls, under vents, near heating pipes, or in shaded bays. In tomatoes, small differences in temperature and humidity translate into different transpiration rates and therefore different water use and salt accumulation. If all probes sit in one area, you end up setting alerts for that area—not for the crop as a whole.
Practical protocol: define one “representative” zone, one “hot/dry” zone, and one “cool/wet” zone. In each zone, avoid placing the probe right next to the same dripper or exactly on a runoff path; you want a meaningful average of the root-explored volume. What to verify: irrigation uniformity (same duration, same pressure). Decision: if an alert appears only in the hot zone, treat a local cause (ventilation, screen position, air distribution), not the whole-greenhouse recipe. Check the result: compare zone differences before and after the intervention.
3) EC in substrate/soil: when it is salinity stress and when it is just a post-drying “spike”
In tomatoes, dry–wet cycling can concentrate salts between irrigations, and the next irrigation can produce an EC spike where the probe sits. The mechanism is simple: water evaporates or is taken up, salts remain; then a short irrigation mobilizes salts locally. A sensor installed too close to the dripper may “see” the incoming nutrient solution rather than the root-zone environment. In soil, salt stratification by depth can amplify this effect at different depths.
What to observe: does EC rise as moisture drops? Does it fall sharply right after a longer irrigation? What to verify independently: collect drain (in substrate) or do a comparable extraction (same method every time) and compare with the probe. Practical decision: if high EC coincides with low moisture and high VPD, the first correction is irrigation rhythm (more frequent, not necessarily more total), not increasing concentration. Check the result: over the next 2–3 days you should see smaller EC swings.
4) pH: real nutrient lockout or an effect of water alkalinity and measurement point
An “incorrect” pH in the root zone can reduce availability of some elements and shift the balance of cation/anion uptake, but interpretation depends on where you measure. Tank pH may be stable while drain pH or substrate-solution pH shifts due to interactions with the substrate, bicarbonates in water (alkalinity), or plant uptake dynamics. Also, pH electrodes are maintenance-sensitive: deposits, dehydration, and slow response can all distort what you think is happening in the crop.
What to observe: do symptoms consistent with imbalance (for example, slow growth or interveinal chlorosis) appear across the house or only in zones? What to verify independently: measure pH with a calibrated portable meter on the same sample; if water alkalinity is high, pH can “rebound” after correction and you’ll see oscillations. Practical decision: before adjusting acid, verify the method (solution, drain, extract) and probe condition. Check the result: track whether pH stabilizes as a trend, not just immediately after mixing.
5) VPD: real climate alarm or a reading that does not match leaf reality
VPD is calculated from air temperature and relative humidity, so it estimates atmospheric demand for evapotranspiration. In tomatoes, high VPD can accelerate transpiration, increase midday water-stress risk, and aggravate calcium transport issues if root uptake can’t keep up. But leaf temperature can differ from air temperature (radiation load, drafts, shading), and a sensor in direct sun or near a heat source will exaggerate VPD.
What to observe: slight midday leaf curl, soft tops, or flower abortion during periods when VPD “jumps.” What to verify independently: compare two points at the same canopy height, shielded from direct radiation and air jets; if possible, spot-check leaf temperature with an IR thermometer (hypothetical example) to see whether air readings overestimate stress. Practical decision: address a local climate driver (shading, screens, ventilation) before compensating with heavy irrigations. Check the result: reduced VPD amplitude and fewer repeatable midday wilting peaks.
6) Irrigation alerts: separating “true thirst” from a clogged dripper or misplaced probe
A low-moisture alert can mean high demand (high VPD), but it can also mean poor distribution: clogged filter, variable pressure, a closed sector, or clogged drippers. In tomatoes, an under-watered zone will often show rising EC as well, and plants will enter stress even if the rest of the greenhouse is fine. Conversely, a probe placed in a naturally drier pocket (bed edge, near a heating pipe) can alarm even when plants elsewhere are unaffected.
What to observe: does the alert always come from the same sector? Does moisture fail to rise after a scheduled irrigation? What to verify independently: visually check flow at several emitters in the alert zone, compare with a no-alert zone, and look for pressure or elevation differences; in substrate, confirm that drain appears after irrigation. Practical decision: if moisture does not respond to irrigation, fix the hydraulics first instead of increasing the global program. Check the result: the moisture curve should show clear pulses after each irrigation event.
7) Fertigation alerts: when EC/pH points to mixing equipment versus plant uptake
If fertigation-solution EC suddenly deviates, the cause can be dosing (injector issues, fertilizer pump problems, air suction), insufficient mixing, or a change in water source. If root-zone EC rises while delivered solution stays constant, it more often indicates accumulation (insufficient irrigation, insufficient drain in substrate, evaporation, low root-zone temperature). In tomatoes, cool root zones reduce uptake and effectively “leave salts behind” to build up over time.
What to observe: is the deviation simultaneous across all zones (solution problem) or only in one (local problem)? What to verify independently: measure EC/pH of source water, solution before it enters the sector, and drain; do not mix media in interpretation. Practical decision: if the issue is in the solution, stop “blind” recipe changes and immediately check dosing equipment and water quality; if it’s local, adjust irrigation rhythm or ventilation in that zone. Check the result: convergence between zones, not perfection at a single point.
8) Commissioning and data quality control: freshness, units, drift and “stuck values”
In diagnostics, data quality is as important as the value. A stale reading (delayed data), misread units, or a slow-responding probe can generate false alarms. With pH, electrodes can drift and may require calibration and maintenance; with EC, deposits or bubbles can affect readings in some measurement chambers; with temperature/humidity sensors, shielding and placement relative to radiation are critical. Don’t assume that “if it’s on the graph, it’s real in the plant.”
What to observe: values that do not change at all (stuck), jumps that are implausible compared to the rest of the greenhouse, or a sensor that consistently reads higher/lower than its peers. What to verify independently: do a spot check with a handheld instrument and record the offset; repeat after 30–60 minutes to see whether the sensor responds. Practical decision: before changing irrigation/fertigation, flag the sensor as suspect and temporarily relax thresholds or confirm with another point. Check the result: after cleaning/relocation/calibration, differences between sensors become explainable by microclimate, not random.
Conclusion
In tomato crops, the “truth” is not a single number but a relationship between climate (VPD), water (moisture), salts (EC), and the plant’s response. A good protocol starts with zone-based placement and comparisons: if only one zone screams, the cause is often local; if all zones move together, check solution and equipment first. Alerts become useful when validated with observations and independent measurements from the same medium.
If you use GrowGuard, set up zones so you can quickly compare row ends, center, and cool/wet areas, then tune alerts to flag persistent deviations rather than brief spikes. Keep a small log of interventions and verify the effect in graphs and plants. For help commissioning sensors and interpreting microclimates, you can request a short discussion with the GrowGuard team.