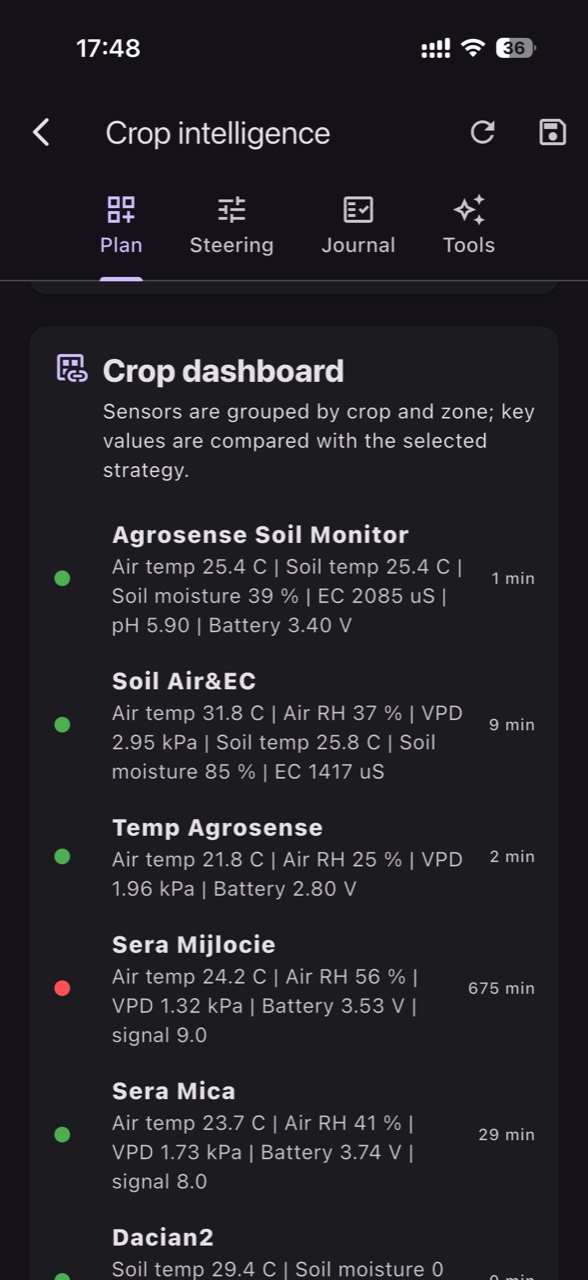
In greenhouse tomato production, the same plant can “tell” two different stories: leaves look turgid in the morning, yet midday wilting appears, and fruit starts showing quality defects. Often the cause isn’t just water volume, but the combination of salinity (EC), solution reaction (pH), and the atmospheric demand for transpiration (VPD). When these drift apart, symptoms appear fast.
Good control starts with a simple distinction: pH and EC are not “symptoms”, but measurements of a medium (water, fertigation solution, substrate extract, soil solution, or drain). VPD is an estimate of the “pull” the air exerts on leaf water, calculated from air temperature and humidity. If you don’t connect these three, irrigation becomes guesswork.
This article explains the technical fundamentals and a commissioning workflow: which sensors to choose, where to place them, how to independently verify the data, and how to set alerts that trigger a clear check and a repeatable decision. The examples are hypothetical, and thresholds must be adapted to cultivar, substrate/soil, water source, and your production goals.
1) Why pH, EC and VPD must be read together, not separately
Tomatoes run intense uptake and transpiration. When VPD rises, the plant pulls more water, and the flow through the root system affects what can be absorbed from the solution and how steadily. If root-zone EC is high at the same time, water becomes harder to extract osmotically, so the plant can show water-stress behavior even when the substrate is moist. pH then shifts nutrient availability, which can mimic a deficiency.
What to observe: wilting at peak hours, thick/rigid leaves or, conversely, soft leaves, flower drop, uneven fruit development. What to verify independently: EC and pH measured in the same medium (for example drain solution, or a consistent substrate-extract method) and VPD calculated from a correctly placed air temperature/RH sensor. Practical decision: don’t automatically “add more water”; first determine whether stress is demand-driven (VPD) or root-zone/chemistry-driven (EC/pH). Check the result by watching next-day midday wilt and whether EC trends back toward your operational target.
2) What you are actually measuring: water, fertigation, drain, substrate extract, or soil
A common mistake is comparing EC in the source water to EC in the substrate as if they were the same number. EC is “dissolved salts” in the measured medium, and the media differ: raw water, tank fertigation solution, drain/leachate, substrate extract, or bulk-soil extract. pH behaves similarly: the water’s pH and its alkalinity can push pH over time even if the mixed solution looks “correct” at dosing.
What to observe: trends, not single values—hypothetically, drain EC climbs daily while the tank recipe stays constant. What to verify independently: periodic spot checks with a calibrated handheld meter and, when needed, a lab water analysis that separates pH, alkalinity, and soluble salts; on-site monitoring complements rather than replaces analysis. Practical decision: if alkalinity is the driver, adjust your pH-correction strategy; if root-zone salts are accumulating, revisit pulse frequency and drainage/leaching behavior. Check the result by confirming drain/root-zone EC stabilizes and plant vigor normalizes rather than seesawing.
3) Sensor choice and trade-offs: accuracy, maintenance, and sampling frequency
A temperature sensor does not measure EC or pH; those require dedicated probes, and probe choice dictates maintenance. pH sensing is sensitive to deposits and drift; EC readings can be affected by imperfect contact with the medium or localized air gaps/dry pockets. In tomatoes, root-zone temperature also matters because it influences uptake rate and the speed of chemical equilibria around the roots. For VPD you need air temperature and relative humidity, ideally measured at leaf height.
What to observe in the data: stepped readings (often a contact issue), pH stuck at one value, EC jumping sharply after irrigation and then staying flat. What to verify independently: calibration per the manufacturer’s method, plus occasional comparison with a reference handheld instrument. Practical decision: set a sampling interval that can resolve irrigation pulses (minutes, not days) and a maintenance rhythm appropriate for pH probes. Check the result by confirming curves show expected responses—moisture rises after a pulse, EC/pH shifts in a coherent direction—without persistent anomalies.
4) Zone-based placement: why one probe can mislead the entire crop
Greenhouses and tunnels develop microclimates: cooler/more humid row ends, warmer/drier central bays, lateral flow differences, and shading variability. A robust plan uses at least one sensor near a representative row, one in a hot/dry zone, and one in a cool/wet zone. In substrate or soil, avoid placing all probes beside the same dripper pattern; otherwise you measure the emitter’s wet spot rather than the active root zone.
What to observe: a higher-VPD zone demands more frequent watering, but may also accumulate salts if drainage differs; a cooler zone can look “wet enough” yet have slow roots and drifting pH. What to verify independently: a walk-through right after an irrigation cycle (uniformity, ponding, drain presence in substrate or infiltration in soil) plus a handheld spot check in two or three nearby points. Practical decision: separate crop zones and configure different alerts by zone (including different “normal” daily patterns). Check the result by seeing fewer, more relevant alerts and reduced differences between row ends and middle after targeted corrections.
5) Commissioning: validating that the data is truly actionable
Before relying on alerts, run a one-week commissioning period: record real events (irrigation start, recipe change, ventilation, shading) and confirm sensors “see” those events. For moisture, you want a rise after each pulse and a gradual decline between pulses. For EC/pH in your chosen medium (drain or consistent extract), you want changes that match recipe shifts and water volumes. For VPD, the daily curve should track heating and ventilation behavior.
Typical failure modes: no reaction after irrigation (probe too far from the wetted/root-active zone), inverted reaction (installation error), impossible values (drift or failed calibration), or long gaps (stale data triggering late alerts). What to verify independently: the sampling interval and transmission latency, plus a hypothetical controlled test—apply one short irrigation pulse and watch for the expected signature. Practical decision: reposition the probe, correct depth, or improve contact with the medium. Check the result by confirming each operational event produces a clear, repeatable data signature you can recognize.
6) Practical workflow: irrigation alerts based on demand (VPD) and root response
Good alerts don’t only say “irrigate”; they say “check X because Y happened.” In tomatoes, start from mechanism: at high VPD, transpiration rises; if roots cannot supply enough, wilting or growth slowdowns appear even if average moisture looks acceptable. A useful alert combines sustained high VPD (for a minimum duration) with an unusually fast moisture decline between pulses in the root zone, indicating demand is outpacing supply.
What to observe: on bright days, moisture drops faster and root-zone EC tends to rise (more water removed than salts exported). What to verify independently: drip uniformity and whether drainage exists (in substrate) or infiltration is adequate (in soil), plus a quick visual check of the growing tip and flower trusses. Practical decision: adjust frequency (more small pulses) or timing (pre-empt the VPD peak) rather than simply increasing total volume. Check the result by seeing a gentler moisture-downward slope and reduced midday wilt the next day, with EC no longer climbing unchecked.
7) Practical workflow: fertigation alerts based on EC/pH in the correct medium
For nutrition, alerts must be tied to where effects occur: the root zone. Tank EC shows what you send, but drain/substrate-extract EC shows what the roots “see.” Solution pH signals nutrient availability tendency, yet it can drift over time due to the water’s alkalinity, temperature, and the plant’s uptake balance of cations versus anions. EC does not identify which element is missing; it only indicates total ionic strength in that medium.
What to observe: root-zone EC gradually rises and then you see leaf-edge burn risk or fruit becomes more sensitive; or pH drifts and symptoms resemble deficiencies. What to verify independently: manual measurements on sampled solution using the same method each time and, when suspicion persists, water and/or solution analysis. Practical decision: if EC is too high, design a “reset” through irrigation and drainage management rather than abrupt nutrient cuts; if pH trends away, adjust correction with awareness of water alkalinity and system inertia. Check the result by expecting stabilization over days and new leaves emerging more uniform than the older, stressed tissue.
8) Error cases and “false alarms”: how to recognize and correct them
Many alerts become noise for two reasons: thresholds set without context, and compromised data. Hypothetical examples: VPD looks low at night but condensation appears because the sensor sits in a cold draft; substrate moisture reads high while the plant suffers because the probe sits in a localized saturated pocket. For pH, drift can create “changes” that are not real. For EC, poor contact with the medium can underestimate real salt accumulation.
What to verify independently: the sensor’s physical position (height, shielding from direct radiation, distance from doors/fans), cable integrity, and calibration routine, plus quick comparisons across zones. Practical decision: add duration conditions (exceedance must persist) and cross-check the alarm with a second parameter (VPD with moisture behavior, EC with drain and moisture). Check the result by seeing fewer unactionable alerts and more consistent team responses to the remaining ones—alerts trigger a defined inspection, not panic.
Conclusion
In greenhouse tomatoes, stability comes from correlation: VPD describes atmospheric demand, moisture describes water availability, and pH plus EC describe the chemical environment the roots must work in. If you measure in the right medium, place sensors by zones, and commission the system to validate responses to real events, alerts become a control tool instead of a stress source.
A monitoring platform such as GrowGuard can support this through zone visualization and alerts for pH, EC, moisture and VPD, but performance depends on protocol: correct placement, calibration, independent checks, and revisiting thresholds after a few weeks of history. If you want, use the structure above as a starting checklist and refine it gradually as you learn your crop and your water.