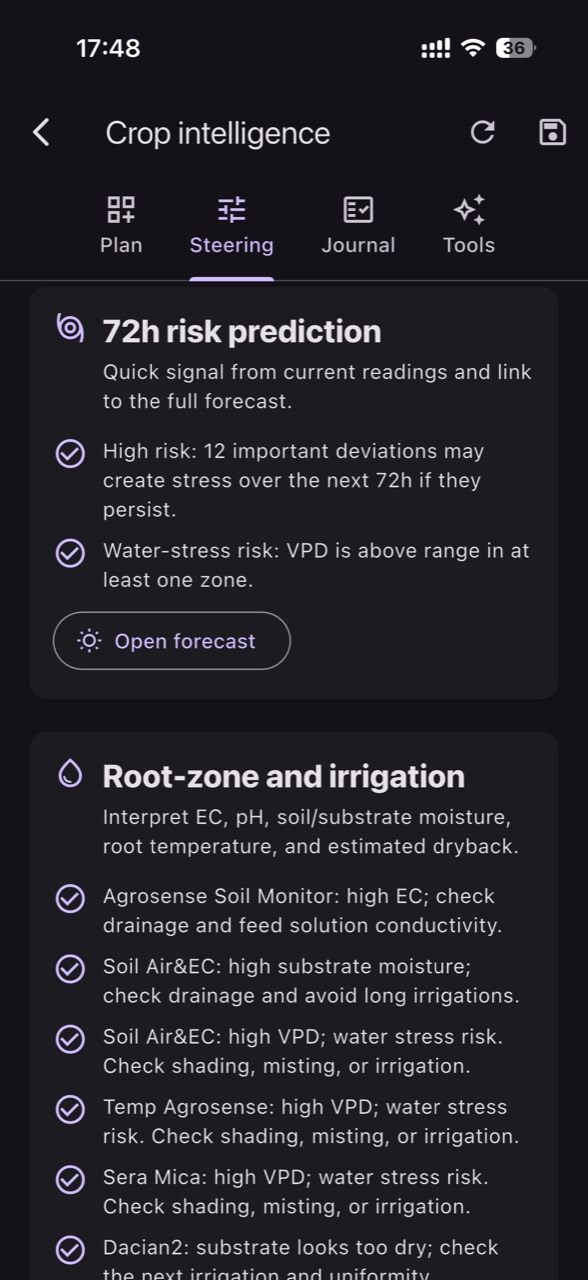
Controlled water stress in vineyards is not “less water at random.” It is applying the right amount at the right time, matched to phenological stage and production goal. The problem starts when a decision rests on a single reading that does not represent the block, or when a sensor sits in an atypical spot—odd soil, shade, runoff, or a drainage line.
In commercial vineyards with slope, differing exposures, and soil variability, two neighboring rows can behave in opposite ways: one enters stress quickly, the other stays wet and overly vegetative. A sensor can be technically “good” but agronomically “wrong” because of placement. Many false alarms begin here: you irrigate according to the sensor, yet the vine tells a different story.
This article is a diagnostic guide: how to choose measuring points, define crop zones, compare microclimates, and independently verify whether stress is real or an artifact of installation, units, or stale data. For each situation you get the mechanism, what to observe, what to verify, a practical decision, and how to confirm the result over the following days.
1) Define the “zone” before you define the “threshold”
Mechanism: in vineyards, roots explore a large volume, while soil, slope, and drainage can change plant-available water quickly. If you treat the entire block as an average, stress usually appears first in specific points (often ridges, corners with shallow soil, or wind-exposed areas). Observe where shoot tips lose vigor, where shoot growth slows first, or where berries start sizing down earlier than elsewhere.
Independent verification: mark 2–4 hypothetical microzones (top/bottom of slope, shaded/exposed, heavier/lighter soil) and repeat scouting at the same hours on multiple days. Practical decision: allocate sensors to the zones that “lead” risk—those that first enter stress or those that stay wet and push vegetation. Result check: after an irrigation, zones should show convergence of trend, not instant equality. If differences widen, the zone definition or sensor placement is likely wrong.
2) Soil-sensor placement: distance from the dripper and useful depths
Mechanism: under drip irrigation, wetting is highly uneven; a sensor too close to an emitter “sees” the irrigation pulse, while one too far away mostly “sees” drying. Depth matters as well: a shallow layer can swing daily, while a deeper layer may reflect the real buffer. In your graphs, watch for sharp jumps after irrigation followed by rapid drops; that pattern can indicate placement in the emitter jet or a very shallow layer.
Independent verification: during installation, open a small soil face and identify the wetted volume after a normal hypothetical irrigation event; place the sensor at the edge of the wetting bulb, not in the saturated core. Use at least two root-relevant depths so you can separate “surface wetting” from “profile recharge.” Decision: if the shallow depth rises but the deeper one does not, increase run time or restructure irrigation into longer pulses. Confirmation: over the next 24–48 hours the deeper reading should decline more slowly, and canopy stress signals should stabilize.
3) When the sensor says “dry,” but the vine does not look stressed
Mechanism: some soils (very stony, highly variable texture) can produce persistently “low” readings without immediate plant stress—especially if roots access a moist crack, a deeper layer you are not measuring, or a localized pocket of water. Observe: leaves with good morning turgor, normal shoot growth, and moderate temperatures even while the sensor indicates constant dryness.
Independent verification: do a manual moisture check (appearance/feel) at the same depth as the sensor and one depth below; confirm the sensor has good soil contact with no air gaps from poor backfilling. Decision: do not immediately raise irrigation volume; first relocate or add a second measurement point in the same zone at a different depth. Confirmation: if the second point shows a different dynamic that better tracks field observations and irrigation events, the first point was likely unrepresentative or installed poorly.
4) When the sensor says “wet,” but you see stress symptoms or uptake problems
Mechanism: “wet” means water is present, not necessarily available to the plant. Compaction, an impermeable layer, or damaged roots can limit uptake; high salinity can also increase the vine’s effort to extract water. Observe: leaves closing during hot hours, slowed growth, yet the soil appears wet; sometimes you also see tip burn or non-specific chlorosis that can be confused with nutrition issues.
Independent verification: check irrigation uniformity (pressure differences, partially clogged drippers) and evaluate salinity separately by measuring EC in the correct medium (irrigation water, fertigation solution, or soil extract—these are not the same measurement). Laboratory analysis complements on-site monitoring; it does not replace it. Decision: if a physical barrier is likely, adjust run time and pauses to improve infiltration; if salinity is likely, investigate the cause before “drowning” the vines. Confirmation: track whether the plant response improves at similar soil-moisture readings and whether sensor dynamics become more coherent with what you observe.
5) Microclimate: why the same soil moisture can mean different stress on different exposures
Mechanism: vine transpiration is driven by atmospheric demand; on exposed slopes, wind and radiation increase water loss, so vines can enter stress even with similar soil moisture. Observe differences between the upper zone (often windier) and the lower zone (often wetter, sometimes with persistent dew). Confusion is common here: the “feeling” of drought is partly an air effect, not only a soil effect.
Independent verification: install air temperature and humidity sensors in two contrasting microclimates and compare their patterns; VPD calculated from air temperature and RH is an estimate and does not perfectly reflect leaf temperature, but it shows relative demand between zones. Decision: differentiate irrigation strategy by zone; sometimes the same amount applied earlier helps the exposed area without overstimulating the wet area. Confirmation: on comparable days, check that exposed vines show fewer stress signs while the wetter zone does not become excessively vegetative.
6) Leaf wetness, persistent humidity, and irrigation that increases disease pressure
Mechanism: irrigation (especially if it supports dense canopies or raises humidity under the fruiting zone) can extend leaf-wetness periods and high humidity, increasing risk conditions for downy mildew, powdery mildew, and rot. This does not mean a sensor “detects disease”—it indicates conditions that can favor it. Observe: dew differences between the block bottom and the ridge, or between shaded rows and well-aired rows.
Independent verification: correlate a leaf-wetness sensor (or a canopy wetness indicator) with morning visual checks: how long moisture remains after sunrise. Decision: if leaf wetness is prolonged in a zone, avoid irrigation timing that boosts nocturnal humidity and prioritize irrigation windows that do not amplify critical hours; intensify scouting in that zone in parallel. Confirmation: verify whether wetness episodes shorten after adjustment and whether symptom pressure remains more manageable during monitoring.
7) Misleading data: freshness, units, drift, and “frozen” values
Mechanism: a sound agronomic decision can be undermined by stale or non-comparable data. A sensor can transmit infrequently, drop out, or show “frozen” values (the same reading for hours) due to power issues, poor contact, or failure. Observe unrealistic jumps, long flat lines without diurnal variation, or graphs that do not react after an irrigation that should logically leave a trace in the soil.
Independent verification: check the timestamp of the last transmission and compare it to the actual irrigation log; confirm units and sensor method (volumetric water content, tension, or a proprietary index) so you do not compare unlike measurements. Decision: if instrumentation is suspect, do not immediately change irrigation; run a controlled test (a short irrigation in one sector) and see whether the sensor responds. Confirmation: if there is no response, installation/equipment is more likely than an agronomic shift. In GrowGuard you can use status and battery alerts to catch these situations early.
8) A microclimate comparison protocol: from hypothesis to verification
Mechanism: to distinguish true causes (water stress, uneven distribution, microclimate demand, salinity, compaction), you need simultaneous comparisons. A single weather station or a single soil sensor cannot describe a vineyard with multiple exposures. Observe: if the issue repeats in the same place and at the same hours, it is often microclimatic; if it follows specific irrigation lines, it is often technical; if it is diffuse, it may be phenological or nutritional.
Independent verification: state a hypothesis and look for the signal that must exist if it is true. Hypothetical example: you suspect low pressure at one end; after irrigation, upstream sensors rise while downstream sensors do not. Decision: intervene locally (cleaning, filter check, pressure correction) or adjust scheduling by zone. Confirmation: within 1–3 irrigation events, the upstream/downstream response gap should narrow and visual canopy uniformity should improve. Using GrowGuard’s zone map can help you see whether the change appears in the relevant points rather than in averages.
Conclusion
Controlled water stress in vineyards is a precision exercise: soil, air, exposure, and irrigation system must be interpreted together. Sensors are not “the truth”; they are tools that become reliable only when they represent a real zone and are validated through observation and simple, repeatable tests. When a reading seems to contradict the vine, treat it as a diagnostic clue—not as the crop being “wrong.”
If you build a microclimate comparison protocol and always check the vine’s response to a controlled irrigation event, you can quickly separate placement, connectivity, or unit issues from real agronomic problems. For zone-based monitoring and status alerts that reduce false alarms, you can use GrowGuard as a single place for history and block-to-block comparison.