In commercial vineyards with slope, mixed exposures, and variable soils, microclimate shifts over short distances. That means water stress and the risk windows for downy mildew, powdery mildew, or rots often appear first in specific points: swales, shaded edges, row ends, or cold-air drainage zones. A single “central” sensor can tell an incomplete story.
Temperature, humidity, and leaf-wetness readings indicate conducive conditions only—not the presence of a pathogen and not a confirmed diagnosis. Likewise, a spike in soil moisture or an hour of leaf wetness can be real, or it can be the result of poor installation, a dirty radiation shield, condensation on the sensor, or a power/connectivity issue.
This article is a diagnostic guide: how to compare microclimates between zones, how to place sensors to capture meaningful differences, and how to separate true crop problems from misleading readings. For each situation we cover the mechanism, what you observe in the vineyard, what to verify independently, a practical decision you can make, and how to check whether it worked.
1) Mapping microclimates: why the “block average” can mislead you
Mechanism: in vineyards, cold air drains downhill, humidity pools in low spots, and radiation plus wind dry the canopy unevenly. Canopy structure (density, height, row orientation) changes air movement and how long leaves stay wet. Two points 150 meters apart can have very different dew nights, and therefore different infection-risk windows, even under the same regional forecast.
What you observe: earlier downy mildew spots or moldy areas in low/shaded sections, or consistent vigor differences at row ends. What to verify independently: mark on a map where dew persists, where leaves stay stuck after rain, where soil ponds, or where it dries fast. Practical decision: split the block into 2–4 operational zones (top/bottom, shaded/exposed, heavy/light soil) and plan monitoring by zone. Result check: if zoning is correct, differences repeat in history; they don’t appear randomly.
2) Where to place microclimate sensors: height, exposure, and the “row-end effect”
Mechanism: air temperature and humidity depend strongly on sun exposure, proximity to the soil surface, and canopy ventilation. A sensor mounted too close to the ground will “see” stronger inversions and higher humidity than the active leaf area. A sensor in direct sun, or near a heated metal post, can overestimate temperature—artificially lowering relative humidity and the estimated VPD.
What you observe: readings that diverge from what you see in the row (for example, “dry” data when leaves are visibly wet). What to verify independently: compare with a spot manual measurement (portable thermometer/hygrometer) at the same place and moment; check the radiation shield and confirm the probe isn’t pressed against leaves, wires, or posts. Practical decision: place the sensor at the representative canopy zone for risk (often within the canopy mass, but with airflow), not outside the row. Result check: after repositioning, daily patterns should align with day/night cycles and vineyard observations.
3) Leaf wetness: a favorable condition, not proof of disease (and not a simple measurement)
Mechanism: leaf-wetness sensors respond to liquid water (rain, dew, fog, spray), but they are sensitive to installation: angle, exposure, direct droplet impact, or runoff. In a vineyard, real leaves wet unevenly—the exterior dries quickly in wind while the interior stays damp. So a “wet” reading may represent a sub-zone rather than the whole row.
What you observe: leaf-wetness alerts when the canopy doesn’t look wet, or wet leaves when the sensor says “dry.” What to verify independently: inspect at dawn in two positions (inside/outside the row) and compare with sensor history; check if the sensor is constantly shaded (it will stay wet longer) or mounted under a drip point from a wire/post. Practical decision: interpret leaf wetness together with temperature and humidity, plus field observations; don’t trigger treatments from a single indicator. Result check: after adjusting placement, the relationship between observed dew/fog and the sensor signal should stabilize.
4) Temperature, humidity, and VPD: when “risk” is really an air–leaf mismatch
Mechanism: VPD is calculated from air temperature and relative humidity, so it is an estimate of the air’s drying power. In vineyards, leaf temperature can be higher or lower than air (direct sun, wind, transpiration, water stress). As a result, two zones with the same air temperature can have different leaf cooling and therefore different drying rates after dew or rain.
What you observe: periods when VPD suggests fast drying, yet the canopy interior stays wet; or under water stress, leaves heat up and symptoms appear while the air data looks “fine.” What to verify independently: occasionally measure leaf temperature with an IR thermometer (hypothetically) and note the difference versus air; assess canopy density and airflow. Practical decision: if data implies fast drying but leaves remain wet, prioritize canopy-aeration work (tying, shoot positioning, adapted leaf removal) before assuming the sensor is wrong. Result check: after intervention, leaf-wetness episode duration should drop in that zone.
5) Soil moisture by depth: separating true stress from a bad installation
Mechanism: active vine roots vary with rootstock, vine age, soil, and management, and available water changes with depth. A sensor placed too shallow can overreact to short rains; one installed in compacted ground or a crack can give “atypical” values. On slopes, runoff and accumulation mean the lower section can remain wetter for longer—even with identical irrigation scheduling.
What you observe: a zone that reads constantly “wet” while vines show stress, or the opposite. What to verify independently: dig a small inspection profile after rain/irrigation to see whether moisture reached the depth being measured; observe response—if you irrigate, the sensor should show a logical increase, not chaotic delayed jumps. Practical decision: install at least two relevant depths in key zones (for example, a shallower and a deeper layer) and avoid odd points (edges, wheel tracks, row ends). Result check: a correct profile shows clear events (rain/irrigation) and gradual daily drawdown between them.
6) Microclimate and disease: compare possible causes—don’t “confirm” downy mildew or powdery mildew
Mechanism: downy mildew, powdery mildew, and rots are influenced by combinations of temperature, humidity, leaf-wetness periods, and canopy condition. But favorable conditions are not sufficient without inoculum sources and exposure of susceptible tissues. Plant debris, planting material, or water can maintain pathogens; sensors do not detect the pathogen—only the context that can favor it.
What you observe: repeated “risk” alerts with no symptoms, or isolated symptoms even when “risk” appears low. What to verify independently: scout along transects across contrasting microclimates; check for shaded basal leaves, compact clusters, wounds, and weeds that hold humidity. Practical decision: use data to choose where to intensify scouting and where to prioritize interventions (canopy work, mid-row vegetation management), not as a diagnosis. Result check: after changing canopy management in one zone, you should see shorter wetness duration and slower symptom development versus untreated zones (hypothetically).
7) Misleading readings: spotting drift, stuck values, and communication problems
Mechanism: a sensor can report “frozen” values (unchanged for hours/days), drift gradually, or transmit infrequently due to battery or signal. In vineyards these failures are easy to confuse with a “stable” microclimate. Stale data can trigger wrong interpretations: a real rainfront doesn’t appear in the series, or a sudden drop is actually a reconnection artifact.
What you observe: large jumps with no transition, periods with no diurnal swing, or weak correlation between zones during the same weather event. What to verify independently: check data freshness (time of last transmission) and compare with a second reference (nearby weather source or direct observation). Inspect physically: dirty shield, strained cable, sensor buried in vegetation. Practical decision: treat it first as an instrument problem—cleaning, repositioning, temporary replacement, or checking with a handheld tool. Result check: normal daily variability returns, and zones track one another during shared weather fronts.
8) A zone-based decision protocol: from alert to action, then proof of outcome
Mechanism: a good decision starts from an explicit hypothesis: “the lower zone stays wet because wind is blocked,” “heavy soil retains water and extends risk,” or “the sensor is shaded and overestimates leaf wetness.” Without a hypothesis, you risk uniform actions (treatments, irrigation, leaf removal) in a vineyard that actually runs on distinct microclimates.
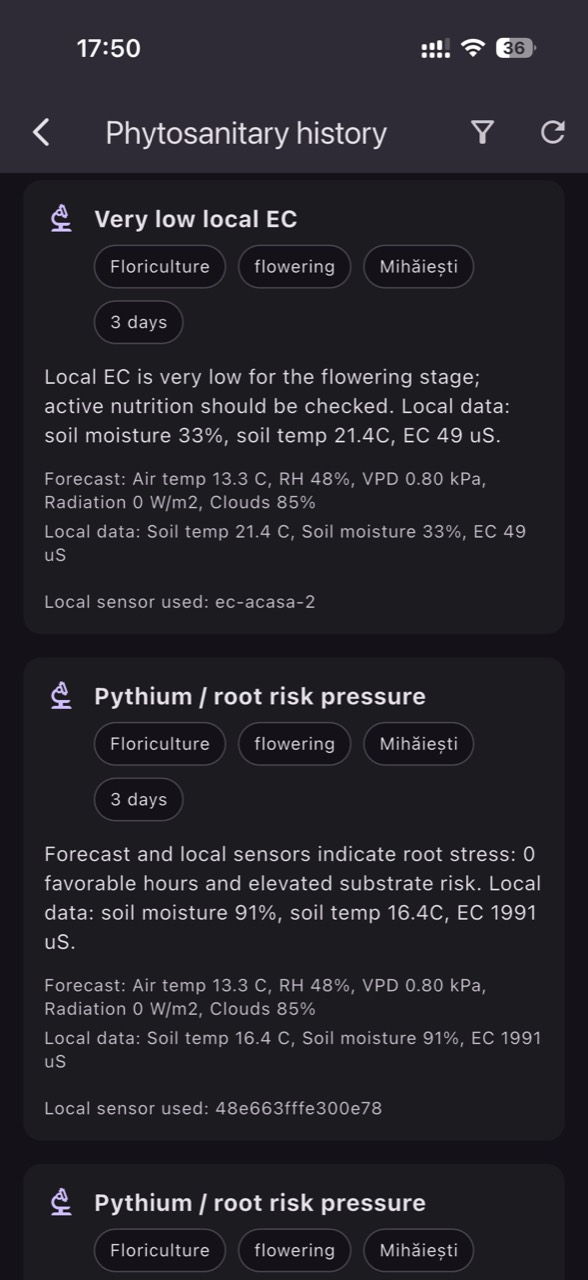
What you observe: alerts concentrated in one area and repeating after similar events. What to verify independently: confirm in that zone (real leaf wetness, ponding, canopy density) and confirm the sensor is representative. Practical decision: choose a targeted action and a control metric—for example, after canopy work you track shorter leaf-wetness duration; after an irrigation adjustment you track the shape of the moisture curve by depth. Result check: compare before/after in the same zone and in parallel with a “control” zone. In GrowGuard, zone maps and history help you see whether the change is real or merely a passing weather episode.
Conclusion
Sensor readings become genuinely useful in vineyards when they are tied to a place, a mechanism, and a quick field check. Microclimate is not uniform, and disease risk is not a simple yes/no alarm; it is a combination of favorable conditions, susceptibility, and management. That’s why the first step is not searching for universal setpoints, but building comparisons between zones and correcting unrepresentative measurement points.
If you want fewer false alarms and earlier response where problems begin, start with two contrasting zones (top/bottom or shaded/exposed), validate installation, and build the habit of “alert → hypothesis → verification → action → outcome check.” For teams working across multiple blocks, zone-based monitoring and history in GrowGuard can support the same logic—without replacing observation in the vineyard.