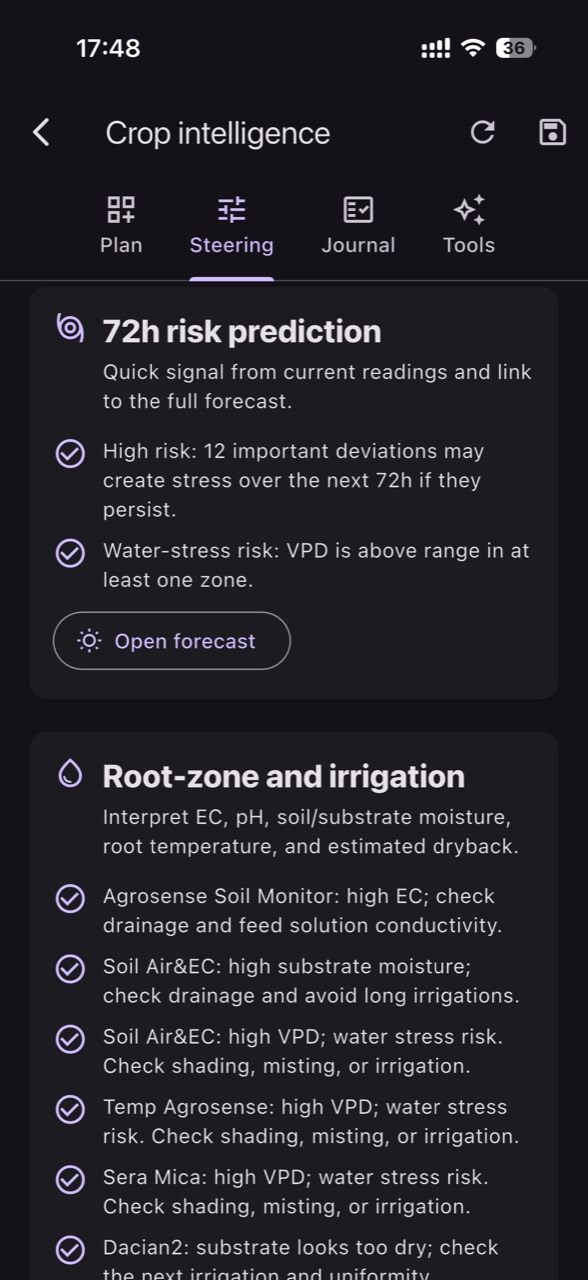
In walnut and hazelnut plantations, water stress often arrives in “waves”: after windy, clear-sky periods, on light soils, or in sectors where localized irrigation doesn’t wet the active root zone evenly. That’s why treating a single sensor reading as absolute truth can lead to wrong decisions—especially when microclimates differ between blocks.
A “too dry” reading can be a real problem (insufficient water in the root zone), but it can also be an artifact: installation too close to a dripper, poor soil contact, a damaged cable, the wrong depth for the crop and soil texture, or simply an atypical spot in the plantation. A good monitoring program starts with a diagnostic protocol, not universal thresholds.
Below is a practical protocol to separate a crop problem from a measurement problem, focusing on sensor placement, defining crop zones, and comparing microclimates. For each situation you’ll get: the mechanism, what to observe, what to verify independently, a practical decision, and how to check afterward whether it actually worked.
1) Why walnut and hazelnut can produce “misleading” water-stress readings
Walnut has a large canopy and can face high evaporative demand in hot periods; hazelnut, while architecturally different, can slip into stress quickly on low water-holding soils or where competition from grass is strong. In both crops, active roots are not distributed perfectly symmetrically, and with drip irrigation you create wet “bulbs” that do not represent the entire soil volume the tree explores.
What you observe: vigor differences between rows, smaller leaves, reduced annual shoot growth, marginal scorch, or premature leaf drop in severe cases. What to verify independently: a spade/soil probe inspection to see wetting depth and continuity, plus checking emitter flow in suspicious points. Decision: address irrigation uniformity and weed competition first; check the result by repeating soil probing and by looking for a stabilized sensor trend—not by judging a single day.
2) Sensor placement: what “the root zone” means under localized irrigation
Mechanism: the sensor measures a very small soil volume, while localized irrigation creates strong horizontal and vertical gradients. If you place it directly under a dripper, you’ll see sharp moisture peaks that can hide a deficit between emitters; if you place it too far away, you can “diagnose” drought even when the tree is adequately supplied by a well-positioned wet bulb. In walnut and hazelnut, the best position depends on emitter spacing and how you manage the herbicide strip/grass.
What you observe in the data: very rapid rises immediately after irrigation (possibly too close to the water source) or, conversely, almost no response even though you irrigated (possibly outside the wet bulb). Independent verification: mark the sensor’s position relative to the emitter and dig two spade sections—one near the emitter and one at the sensor—to confirm whether there is a continuous wetted connection. Decision: relocate the sensor to a representative (not extreme) point; check success by seeing a moderate, repeatable response at subsequent irrigations.
3) Depths and layers: when “dry” near the surface does not mean stress
Mechanism: the top layer dries quickly through evaporation, especially on exposed rows and on windy days, while a deeper layer may remain wet enough for uptake. In walnut, uptake can extend deeper depending on soil and tree age; in hazelnut, a substantial share of active roots can remain relatively shallow, but that distribution shifts with soil management and mulching. A shallow sensor can therefore exaggerate stress when deeper water is available.
What you observe: a shallow sensor drops sharply during the day while a deeper sensor stays stable; the plant still looks fine in the morning and shows no midday wilting signs. Independent verification: check moisture down the profile (probe/spade) and watch whether leaves lose turgor at the hottest hours. Decision: don’t automatically increase irrigation just because the surface layer is dry; check results by comparing trends at two depths and by tracking the uniformity of vegetative growth over the following weeks.
4) Crop zones: soil, slope, exposure, and competition—one orchard, two realities
Mechanism: even a slight slope changes runoff, infiltration, and effective soil depth; a low area may have finer texture or accumulate water, while an upper area with stony, shallow soil dries quickly. In walnut and hazelnut, microclimate differences (wind, radiation, temperature inversions) change evapotranspiration and therefore the meaning of the “same” soil-moisture level. If you treat the whole plantation as one zone, you end up with contradictory alarms or decisions.
What you observe: different responses to the same irrigation (one sector stays “wet,” another declines quickly), or symptoms only along a wind-exposed edge. Independent verification: note texture, stone content, slope, and grass cover by sector, plus short infiltration observations (ponding, crusting, how fast water disappears during irrigation). Decision: define separate zones and compare only “like with like”; check results by reduced within-zone variation and by alerts that trigger coherently only where real risk exists.
5) Readings that don’t match irrigation: a real system fault or a badly installed sensor?
Mechanism: if a line has low pressure, a filter is clogged, or emitters are blocked, soil won’t receive water even though the schedule ran. But the same “no wetting” pattern can occur when the sensor has poor soil contact (air gaps), was installed in disturbed backfill (loose planting-hole soil), or the cable is under tension and moves the probe. In diagnostics, the first question is whether something physical changed in the field.
What you observe: one sensor shows a flat line with no response to irrigation while other sensors in the same zone respond; or it shows irregular “jumps” unrelated to events. Independent verification: check pressure/flow in that irrigation sector, visually inspect a few emitters, then inspect the installation (depth, firm packing, position). Decision: if infrastructure is suspect, repair irrigation first; if installation is suspect, reinstall correctly. Check results with an “event test”: a short irrigation should produce a logical, repeatable response without random spikes.
6) Comparing microclimates: when the air explains the soil (and vice versa)
Mechanism: two blocks with the same soil can have different water use if one is wind-exposed or receives stronger afternoon radiation. Also, a colder night in a low-lying area can temporarily reduce transpiration so soil readings look “stable,” even though demand may surge the next day under sun and wind. Soil sensors are therefore interpreted more accurately when correlated with air temperature and humidity rather than viewed in isolation.
What you observe: on windy days, soil-moisture decline accelerates in one zone even though irrigation was identical; or after a cold night, the trend looks calm and then drops abruptly at midday. Independent verification: log weather events (wind, heat, clear skies) and check whether differences are consistent year to year or only occasional. Decision: set alerts and interpretations by zone, not by “farm average”; check success when exposed zones prompt earlier interventions and sheltered zones stop generating unnecessary actions. In GrowGuard, zone maps help you see these contrasts over the same time window.
7) Water stress or another stress? Avoid blaming everything on water
Mechanism: walnut and hazelnut symptoms that resemble drought can be amplified by salinity, unsuitable pH, compaction, or root diseases. A soil-moisture sensor says nothing about salts or pH; those require dedicated measurements taken in the correct medium (water, fertigation solution, substrate extract, or soil), and those measurements are not interchangeable. EC does not identify individual nutrients; it indicates the overall level of soluble salts.
What you observe: moisture appears adequate, yet leaves look stressed, growth stalls, or marginal burn appears. Independent verification: check water quality and, if you fertigate, clearly separate pH/EC measurements of irrigation water from those of nutrient solution and from any soil testing; lab analysis complements quick on-site monitoring rather than replacing it. Decision: don’t “flush” the soil or increase irrigation based on symptoms alone; check success by correlation—symptoms improve only when the true cause (for example, a salts issue) is addressed, and sensors return to normal trends without over-wetting the root zone.
8) Stuck values, delayed data, and units: diagnostics start with data quality
Mechanism: a value that remains identical for a long time can indicate power, connectivity, or probe failure; a “perfectly smooth” line in a variable field environment deserves scrutiny. Interpretation also depends on units: some sensors report volumetric water content while others report soil water tension, and there is no universal conversion without soil-specific calibration. A commissioning protocol reduces false alarms dramatically.
What you observe: no reaction to rain/irrigation, large time offsets from real events, or changes that appear only when a signal returns. Independent verification: compare with a second point (a nearby sensor or a manual check), note the exact time of irrigation and rainfall, and confirm the data captures those events. Decision: before changing irrigation, fix data “freshness” and confirm the graph reflects real events; check results over a short period (for example, one week) where each irrigation produces a coherent response and alerts stop firing due to missing data. In GrowGuard, status and battery alerts can help separate a field issue from a sensor issue.
Conclusion
In walnut and hazelnut, soil monitoring becomes truly useful when you treat sensors as diagnostic tools rather than final judges. Placement relative to wet bulbs, selecting appropriate depths, defining zones by soil and exposure, and correlating with microclimate sharply reduce misinterpretations. Just as important: any suspicious reading deserves an independent field check.
A simple protocol works: observe the plant, physically verify soil and irrigation, then confirm in the data whether your intervention changed the trend in a logical way. If you use GrowGuard to compare zones and history over the same interval, you can separate real water stress from misleading readings faster. For the next step, build a zone map and a minimal routine of periodic checks with your team so alerts become credible signals, not noise.