In walnut and hazelnut plantations, water stress does not look the same everywhere. Two neighboring blocks can receive the same rainfall yet respond differently because of soil texture, slope, wind exposure, planting density, or differences in mulching. That is why “irrigating by calendar” is risky—especially when the crop enters sensitive phases for growth and kernel filling.
Monitoring the soil means more than a single moisture value. What matters is where you measure (depth and distance from the dripper), what you measure (water content versus tension), how fresh the data is, and whether the sensor actually represents that zone. In walnut and hazelnut, roots explore large volumes, while localized irrigation creates discrete wet bulbs that can hide deficits between rows.
A good workflow has three parts: commissioning (correct installation, checks, and practical calibration), interpretation (linking readings to phenology, weather, and soil), and field validation (probing, inspection, and checking the effect of irrigation). Monitoring platforms such as GrowGuard help when you treat each block as a separate “zone” and systematically verify outcomes—not when you chase a universal threshold.
1) Walnut and hazelnut specifics that change how you read the soil
Walnut has high water demand during periods of strong vegetative growth and kernel filling, and deficits can translate into reduced shoot growth, early leaf drop, or uneven nut sizing. Hazelnut can react quickly to wet–dry alternation in the active root zone, especially on lighter soils. In both species, water stress can remain “silent” until quality or uniformity is already compromised—so the goal is to detect the trend early, not the damage late.
What to observe: the evolution over time, not an isolated number. A steadily declining available-water trend in the irrigated zone combined with hot, windy days signals risk. What to verify independently: irrigation distribution (row-to-row uniformity) and early symptoms (slightly curled leaves, slower growth, duller foliage). Practical decision: adjust irrigation timing, not necessarily volume. Check the result: after irrigation, the sensor should show coherent recharge at the target depth, and field checks should confirm moisture where active roots are.
2) What “soil monitoring” really means: quantities, units, and traps
Two families of measurements are commonly useful: volumetric water content (often expressed as a fraction or percent) and soil water tension (for example with tensiometers, expressed as pressure units). Water content tells you how much water is present, but its meaning depends strongly on texture and bulk density. Tension indicates how hard the plant must work to extract water, which is often more intuitive for stress, but it has limitations in very sandy soils or when soils become very dry.
What to observe: unit consistency and the measurement medium. A sensor installed into a small air pocket or very loose backfill can read incorrectly; a sensor placed too close to a dripper may always look “fine” even if the inter-row is dry. What to verify independently: a probe/auger check at the same depths and an infiltration check after an irrigation event. Decision: choose sensor type based on soil and objective (scheduling versus diagnosis). Check the result by comparing sensor response to a controlled irrigation and to actual moisture in the soil profile.
3) Choosing the right sensors for walnut and hazelnut (without mixing measurements)
For water-stress monitoring, the base is a soil moisture sensor (water content) or a tensiometer, plus soil temperature to interpret biological pace and evaporation dynamics. An air temperature sensor cannot measure pH, EC, or soil moisture: EC and pH require dedicated probes, and EC does not identify individual nutrients. If you fertigate, EC is meaningful only when you specify the medium—irrigation water, fertilizer solution, or a soil extract are different measurements and should not be compared as if they were the same.
What to observe: whether the sensor fits the problem. In a hypothetical case with a loam soil and drip irrigation, a volumetric sensor at two depths can show recharge and daily drawdown. On a heavier soil, a tensiometer can warn that water is becoming hard to access even while “moisture” still looks high. What to verify independently: periodic laboratory water analysis for pH, alkalinity, and soluble salts (EC). On-site pH/EC checks complement, not replace, lab analysis, and must be done on the same sample type. Decision: if salinity symptoms appear, do not conclude from soil EC alone without context and confirmation.
4) Zone-based placement: where to put sensors so they represent the block
In orchards, variability comes from soil (texture, gravel, restrictive layers), topography (low spots versus ridges), wind exposure, and irrigation differences (pressure variation, clogging). A common mistake is making decisions from a weather station “by the yard” while the microclimate in a low or exposed block can be completely different. For walnut and hazelnut, you need zones that separate soil and irrigation behavior—not just one central point.
What to observe: representativeness and depth. Ideally, place one set in a “typical” area and one in a problem area (for example, a line end or a lighter soil patch), then compare. Independently, verify uniformity: at least periodically, check emitter flow at several points and inspect pressure behavior by sector. Decision: if the problem zone dries faster, adjust sectoring or runtime for that zone rather than “raising” irrigation across the whole plantation. Check the result: differences between zones should shrink after intervention, and any remaining variation should be explainable by soil and weather, not irrigation faults.
5) Commissioning: steps that reduce false alarms and useless data
Commissioning starts with correct installation: good soil contact, no voids, protected cables, recorded depths, and consistent distance from the dripper across zones. Next comes functional verification: data must be fresh (a transmission interval that makes sense for decisions), and values should not be “stuck” for hours when conditions are changing. For soil sensors, a practical commissioning check is response to a controlled event: a meaningful irrigation or a solid rainfall should produce a logical change—first at shallower depth, then at the deeper sensor.
What to observe: the irrigation signature. If irrigation starts and the 20–30 cm sensor does not move at all, you typically have three hypotheses: water is not reaching that point (clogged/failed emitter), the sensor is outside the wetted zone, or installation contact is poor. What to verify independently: go to the field, dig a narrow section near the measurement point to see the wetting front, and confirm emitter function. Decision: reposition the sensor or fix irrigation before setting thresholds. In GrowGuard, separating readings by zones helps you see quickly whether an issue is local or general.
6) Interpreting water stress: link soil, atmosphere, and phenology
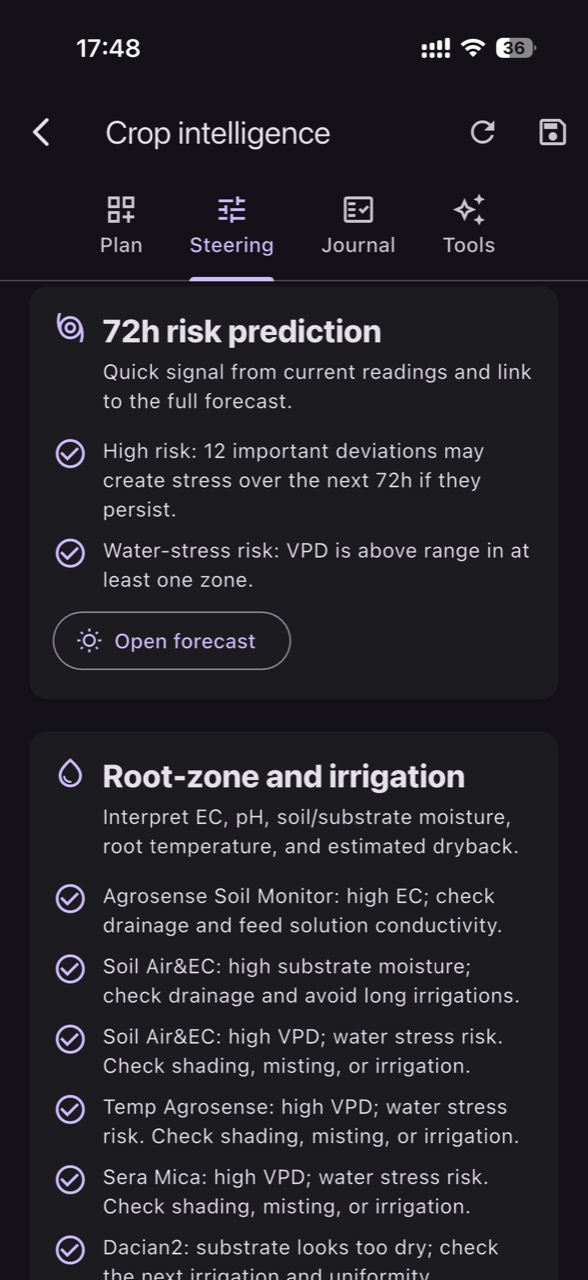
On days with high evaporative demand, the same soil water level can support the plant differently than on a cloudy day. That is why it helps to connect soil moisture with air temperature and humidity; from these, VPD can be estimated. However, VPD is an estimate of atmospheric “demand,” and leaf temperature can differ from air temperature. In walnut and hazelnut, critical periods are those when growth and fruit filling require consistent supply; repeated stress—even if short—accumulates into quality effects.
What to observe: timing between soil drawdown and weather. In a hypothetical example, if soil declines only moderately but you have two windy, hot days, the plant may enter stress earlier than the soil number alone suggests. What to verify independently: inspect the canopy in mid-to-late afternoon when stress shows best; check for weed competition in the irrigated strip. Decision: instead of drastically increasing volume, you might advance irrigation or split it into two cycles to keep the active zone supplied. Check the result: daily drawdown becomes smoother, and the plant maintains turgor through the critical hours.
7) Thresholds and alerts: establishing them locally without universal settings
Useful thresholds are built from your own block’s history: identify the moisture/tension level where first stress signs appear, and the level beyond which irrigation no longer brings benefits (risk of root oxygen stress or deep percolation losses). This differs across soil types and positions in the orchard. For alerts, the logic often matters more than the exact number: alert on trend (rapid decline), on missing recharge after irrigation, or on abnormal differences between similar zones.
What to observe: “tested” thresholds and alerts that request a check, not an automatic reaction. In a hypothetical scenario, set an alert if, after a normal irrigation, the main-depth sensor does not show recharge within a reasonable time window—suggesting a defect or insufficient infiltration. What to verify independently: compare against irrigation logs and inspect the sector, including filters and line ends. Decision: fix the cause (hydraulic issue, placement, program) first, then adjust the threshold. With GrowGuard you can set zone-based alerts so an anomaly at a row end does not create noise for the entire plantation.
8) Evaluating an intervention: confirming irrigation actually solved the problem
After any decision (start, stop, change duration, change frequency), verification should be dual: in data and in the field. In the data, look for three signals: recharge at target depth, a logical delay between depths (wetting front movement), and then a stable consumption curve. In the field, confirm moisture uniformity in the wetted strip and check for spots that remain dry (possible clogging) or too wet (leaks, over-irrigation).
What to observe: the effect on variability between zones and on consumption rhythm. If after adjustment one zone remains consistently “wetter” than the rest, you may have a heavier soil or a leak; if it stays “drier,” you may have pressure losses or damaged emitters. What to verify independently: inspect the irrigation system and check soil moisture 24–48 hours after irrigation to see whether water reached active roots, not only the surface. Decision: refine sectoring or reconfigure measurement points. Check results over time: reduce oscillation amplitude and avoid repeating stress in the same zones.
Conclusion
Soil and water-stress monitoring in walnut and hazelnut becomes useful when treated as a protocol: choose the right quantity (water content or tension), place sensors in representative zones, commission with field checks, and interpret readings in the context of weather and phenology. Then, for every intervention, look for confirmation both in the data (recharge and trend) and in the real soil profile.
If you want to bring order to these block-level checks and track differences between zones, a monitoring platform such as GrowGuard can support the routine through zone visualization and alerts—provided you keep the discipline of independent field verification. Start with two zones, one “test” irrigation, and a short observation log, then expand gradually.