In winter wheat and barley, the available water in the root-explored layer sets the pace of tillering, the crop’s ability to recover after cold spells, and the stability of grain fill. At the same time, climate risk is not only “hot” or “rain/no rain”, but combinations of temperature, wind, evaporation, and soil structure—different across zones inside the same field block.
Soil-moisture monitoring becomes useful only when it is commissioned correctly: appropriate depths, representative points, understood units, and independent checks that confirm the sensor is seeing what it should. Without that step, it is easy to make decisions from a “farm average”, overlooking headlands, sandy patches, or elevated ridges that enter stress first.
This article explains the technical fundamentals and a practical workflow—from choosing sensors (NB-IoT or LoRaWAN) to setting alerts and validating them in the field. You will also see how to combine soil data with forecast context to prioritize scouting, plan interventions, and manage risk without assumptions or rigid irrigation templates.
1) Why wheat and barley “feel” water and climate differently by zone
Wheat and barley have different sensitive windows through the season, and drought effects shift with growth stage. Tillering can slow when available water drops in the upper layer; later, during stem elongation and head formation, deficits show up as fewer grains and lower grain weight. Barley is often earlier, which may partly escape late heat, but it can be vulnerable when stress arrives abruptly and the crop has little time to compensate.
What you observe in practice: color and density differences between micro-zones, compaction tracks, old ponding marks, surface crusting, or spots where wind dries faster. What you verify independently: a spade profile, rooting depth, structure, and any anaerobic smell in wetter areas. The decision: define 2–4 management zones (hypothetical example: “sandy plateau”, “depression”, “heavy soil”) and monitor them separately. Check the result by comparing moisture trends and crop status between zones, not by a single isolated reading.
2) What you are actually measuring: volumetric moisture, temperature, and weather context
A soil-moisture sensor typically reports volumetric water content or a correlated index—not “liters” and not “available water” directly. Correct interpretation depends on soil texture and good soil contact. Soil temperature plays a dual role: it indicates biological pace (mineralization, root activity) and explains why the same moisture reading can mean very different stress at 6°C versus 22°C.
What you look for in the data: drying curves (progressive decline), response to rainfall (step changes), and stability differences across depths. What you verify independently: a rain gauge (even a manual one), a tactile assessment in the profile, and—if feasible—a simple infiltration check to understand how quickly water enters. The decision: define local “operational thresholds” (not universal setpoints), based on when the crop shows first signs and on zone-to-zone differences. Check the result: after a rain event, sensors should show recharge at depths reached by water, with a time lag that makes sense for that soil.
3) Choosing sensors and connectivity: NB-IoT or LoRaWAN
For field-scale blocks, start with what you need to monitor: soil moisture and soil temperature (core), plus air temperature and humidity to interpret evaporation and heat waves. NB-IoT may fit where cellular coverage exists and you want straightforward installation across distant points. LoRaWAN can be attractive when you need multiple points and can provide radio coverage via a farm or local infrastructure.
What to observe: signal stability and data frequency (freshness). In practice, sparse data can hide short risk peaks (a hypothetical example: a two-hour frost) or make it hard to see when the topsoil dries quickly. What to verify independently: during the first 7–10 days, confirm there are no transmission gaps and that the device time is correct (otherwise hourly interpretation becomes misleading). The decision: pick a reporting interval that captures meaningful changes rather than relying on assumptions. Check the result using an event log—rain, wind, field operations—and correlate it with the data series.
4) Zone-based placement: representative points, not the “most convenient spot”
Incorrect placement is the most common cause of weak decisions. In wheat and barley, the zones that enter stress first are often lighter-textured soils, shallow profiles above a compacted layer, wind-exposed ridges, or headlands with repeated traffic. A “near the road” location can be atypical: different structure, compaction, and water dynamics than the productive center of the field.
What you assess before installation: soil maps, yield history, visible patterns after rain (ponding), and vegetation differences. What you verify independently: 2–3 short soil profiles in each proposed zone to confirm texture and the effective rooting depth. The decision: install at least one point in the “most vulnerable” zone and one in the “average” zone, so you can see both the onset of stress and how the rest of the field behaves. Check the result: under the same rainfall, zones should respond differently—and the difference should make agronomic sense, not look like an installation anomaly.
5) Depths and installation: avoiding “nice-looking” but useless measurements
Cereal roots often explore a relatively deep profile, but the active distribution depends on layering, compaction, and growth stage. That is why a single measurement depth can miss both the rapid drying of the upper layer and the more stable buffer deeper down. Installation must ensure strong soil contact; air gaps around the sensor can read falsely “dry” or cause delayed, distorted responses to rainfall.
What in the data suggests installation trouble: nearly constant values over many days, unrealistic jumps without rain, or two depths moving identically (even though their inertia should differ). What you verify independently: if possible, inspect the installation, check the soil density around the sensor, and restore natural compaction. The decision: choose depths that represent both the layer where stress starts and the buffering reserve (hypothetical example: a shallower and a deeper sensor in the same zone), then track the gap between them. Check the result after a rain: the shallow layer should respond first; deeper layers should respond only if water infiltrates far enough.
6) Commissioning in the first 14 days: quick checks that protect the season
Commissioning means proving the whole chain works: soil–sensor–transmission–platform–interpretation. In the first two weeks, focus on three items: (1) data freshness (when the last reading occurred), (2) consistency across depths and zones, and (3) consistency with real events (rain, traffic, frost). If any link fails, you risk building alerts and thresholds on an unverified instrument.
What to observe and write down: minimum-temperature hours, windy periods, rainfall, and any operation that can change infiltration (harrowing, rolling, traffic). What to verify independently: a field check on the day you see a large data shift, to confirm it is not a contact or positioning issue. The decision: set alerts only after you have seen at least one realistic wet–dry cycle in each zone. In GrowGuard, soil-moisture and temperature alerts can be set by zone, but thresholds still need field validation. Check the result by fewer “false alarms” and by alerts sending you to a point where you find a real condition worth acting on.
7) Interpreting climate risk: heat waves, frosts, and “invisible drought”
Climate risk in cereals is not only the extreme, but also the combination that accelerates water loss: high temperature, radiation, wind, and low relative humidity. Even with seemingly acceptable deeper moisture, the upper layer can become limiting for young roots or for nutrient uptake. With frost, air temperature at 2 meters can differ from temperatures near the soil surface or at head height, so interpretation must remain cautious.
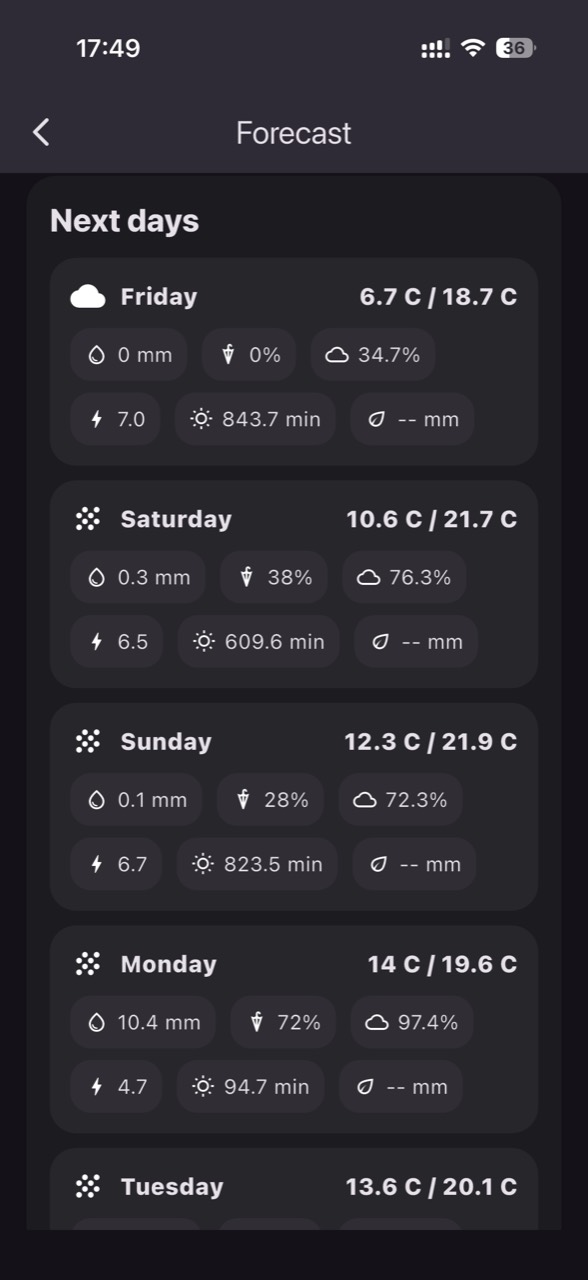
What you observe: the link between top-layer moisture decline and high-evaporation days; in frost, you track time spent below stage-relevant thresholds, not just the minimum. What you verify independently: inspect the growing point/tissues after a cold event and, during heat, assess temporary wilting or slowed growth in vulnerable zones. The decision: use the forecast as a prioritization tool (when to go to the field, which zones to check first), not as certainty. In GrowGuard you can view sensor history with forecast context, but confirmation remains a field task. Check the result after the event: compare zones and depths, note where stress appeared first, and adjust operational thresholds for the next episode.
8) From data to decisions and back: routine, local thresholds, and data quality control
A useful routine turns charts into repeatable steps: check daily trends (drying), compare zones weekly (who reaches stress first), and validate recharge after rain. Local thresholds are built from history: when the crop showed stress, what the sensor read, how long it lasted, and what happened after precipitation. Avoid decisions based on “farm averages”; extreme zones often dictate the loss of potential first.
What to verify independently, periodically: the sensor has not been disturbed by animals or machinery, values are not “stuck”, and battery and communication status remain stable. A typical failure case is rare or missing transmissions that you mistake for agronomic stability. The decision: define a “data too old” rule (if the last reading is beyond your limit, do not decide for that zone) and a verification procedure. GrowGuard can alert on status and battery to help separate a real field issue from a connectivity problem. Check the result with an audit: monthly, compare events (rain, heat waves, frosts) to sensor responses and field notes; where they do not align, correct either installation or interpretation.
Conclusion
Soil-moisture and climate-risk monitoring in wheat and barley is a technical project, not a gadget: choose meaningful zones, install at depths that match rooting reality, validate readings against real events, and build local thresholds tied to growth stage and soil texture. The essential part is the verification loop: data–observation–decision–result check.
If you want to organize zone-based monitoring with clear commissioning checks and practical alerts, you can use GrowGuard to follow sensors in real time together with history and forecast context. A short discussion about your fields, soil types, and objectives helps shape an installation plan that produces credible data—not just graphs.